Cryptocurrency price analysis brought by Coinidol.com. The price of Ripple (XRP) has interrupted its bullish climb above the $3.00 support and started a sideways movement.
XRP long term analysis: bullish
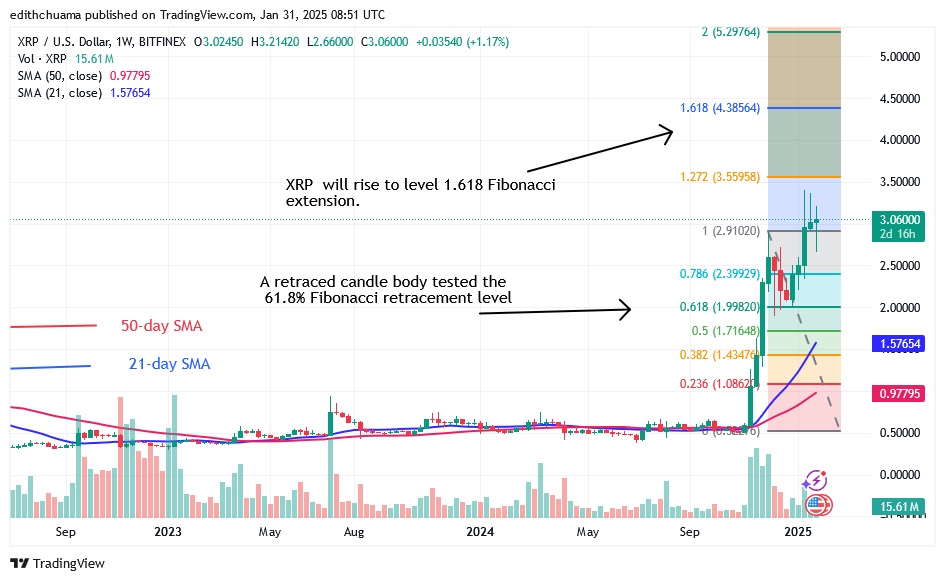
Since January 16, the cryptocurrency has been fluctuating above the $3.00 support and below the $3.50 resistance level. The current sideways movement suggests an upward trend. On the positive side, XRP is likely to gain as soon as the current barrier is broken. If XRP breaks above the $3.50 resistance, it will rise to the Fibonacci extension of $1.618 or $4.38.
On the other hand, if XRP falls from its current high, it will continue to range above the $2.00 support and below the $3.50 resistance.
XRP indicator analysis
The three long candlesticks are pointing towards the resistance zone at $3.50. This suggests selling pressure near the $3.50 resistance level. Similarly, a long candlestick tail near the support level of $2.50 indicates buying pressure. The altcoin will rise as long as the price bars are above the moving average lines.

Technical indicators:
Key resistance levels – $2.80 and $3.00
Key support levels – $1.80 and $1.60
What is the next direction for XRP?
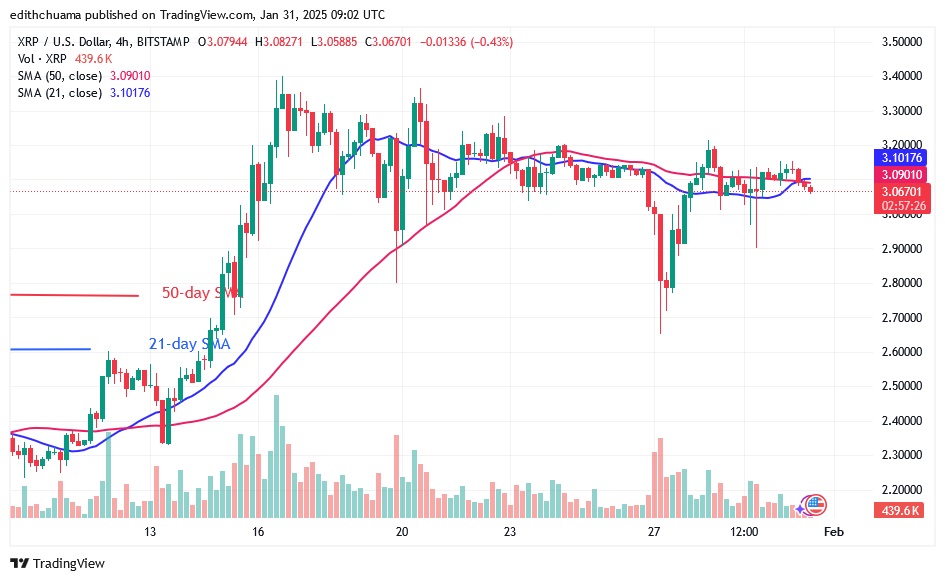
On the 4-hour chart, XRP has continued its sideways movement above the $2.70 support. The price of the cryptocurrency has remained stable and is consolidating due to the presence of doji candlesticks. If the altcoin returns above the current support level of $2.70, it will resume its uptrend. If the altcoin loses support above $2.70, it will drop to a low above $2.00.

Disclaimer. This analysis and forecast are the personal opinions of the author. They are not a recommendation to buy or sell cryptocurrency and should not be viewed as an endorsement by CoinIdol.com. Readers should do their research before investing.


