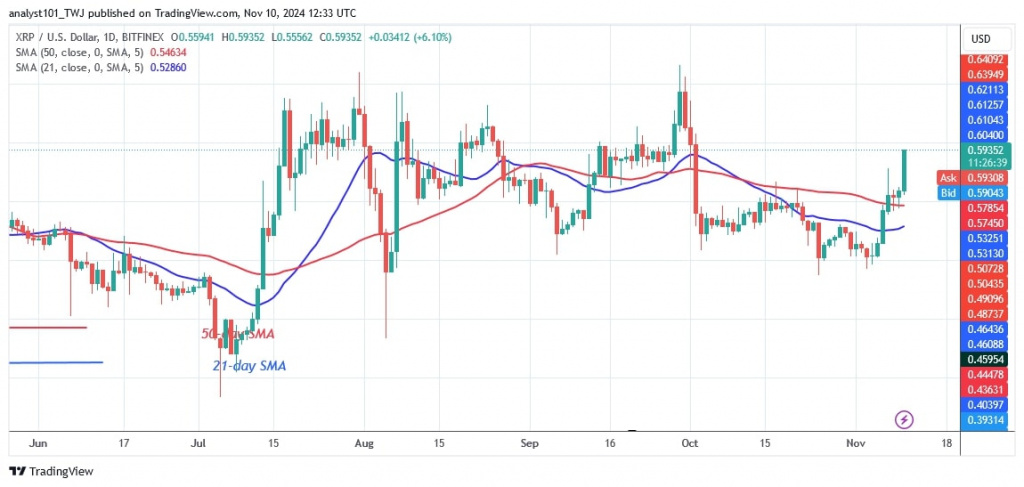
The price of Ripple (XRP) has resumed its uptrend, rising above the $0.50 support and breaking above the moving average lines.
XRP long-term analysis: bullish
For the first time since the price drop on October 3, buyers have kept the price above the moving average lines and Ripple got in the downtrend zone. The cryptocurrency is trading above the $0.50 support but below the moving average lines.
On November 6, the altcoin rose back above the $0.50 support and broke above the moving average lines. Today, XRP has risen to a high of $0.60 at the time of writing.
On the upside, XRP is approaching the overhead resistance at $0.64. The overhead resistance has not been breached since July 17. Nonetheless, XRP will push to the highs of $70 and $74 if the bulls overcome the resistance. However, if XRP breaks through the $64 resistance to the downside, the altcoin will return to the $0.50 to $0.64 range.
XRP indicator analysis
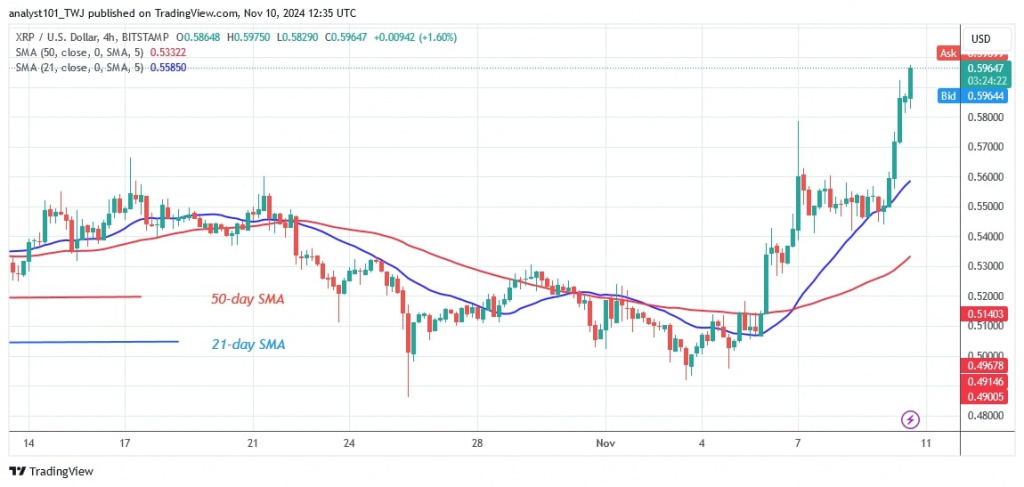
XRP has resumed its uptrend with the price bars returning above the moving average lines. In the previous month, the price bars were below the moving average lines. The moving average lines remain horizontal despite the uptrend. On the 4-hour chart, the moving average lines are sloping north with a bullish crossover.
Technical indicators:
Resistance Levels – $0.80 and $1.00
Support Levels – $0.40 and $0.20
What is the next direction for XRP?
On the 4-hour chart, XRP has resumed its uptrend, reaching a high of $0.57 on November 7. The altcoin has fallen back above the 21-day SMA support or the low of $0.54 before starting its uptrend. XRP has broken through the current resistance and reached a high of $0.60.
Disclaimer. This analysis and forecast are the personal opinions of the author. They are not a recommendation to buy or sell cryptocurrency and should not be viewed as an endorsement by CoinIdol.com. Readers should do their research before investing in funds.


