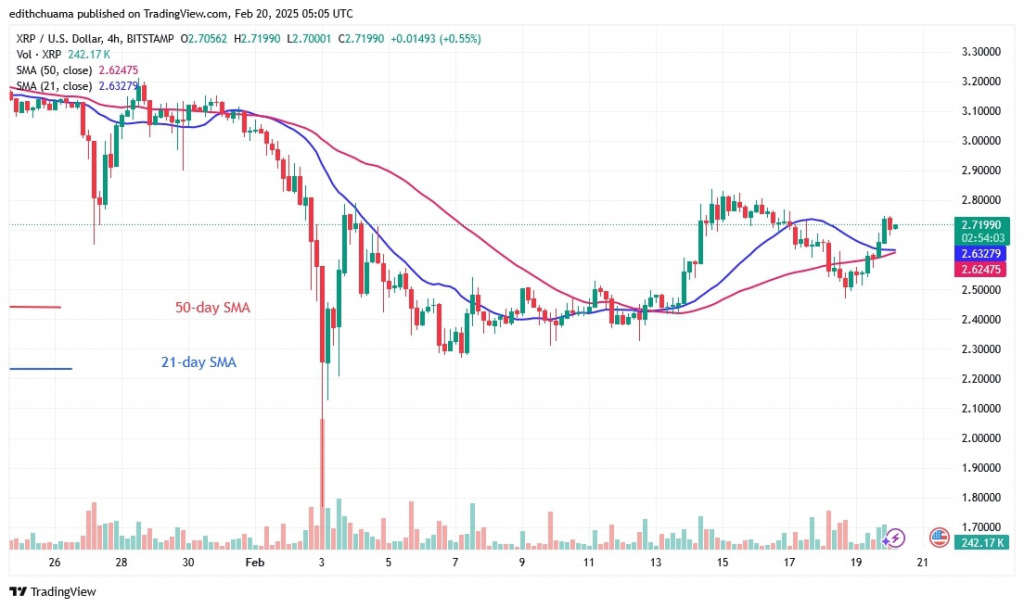
Today, buyers are trying to keep the price of the Ripple (XRP) coin above the moving averages.
The price of XRP is recovering after its decline on February 3. The coin recovered above $2.20 and started its price movement below the moving average lines.
XRP long-term analysis: bearish
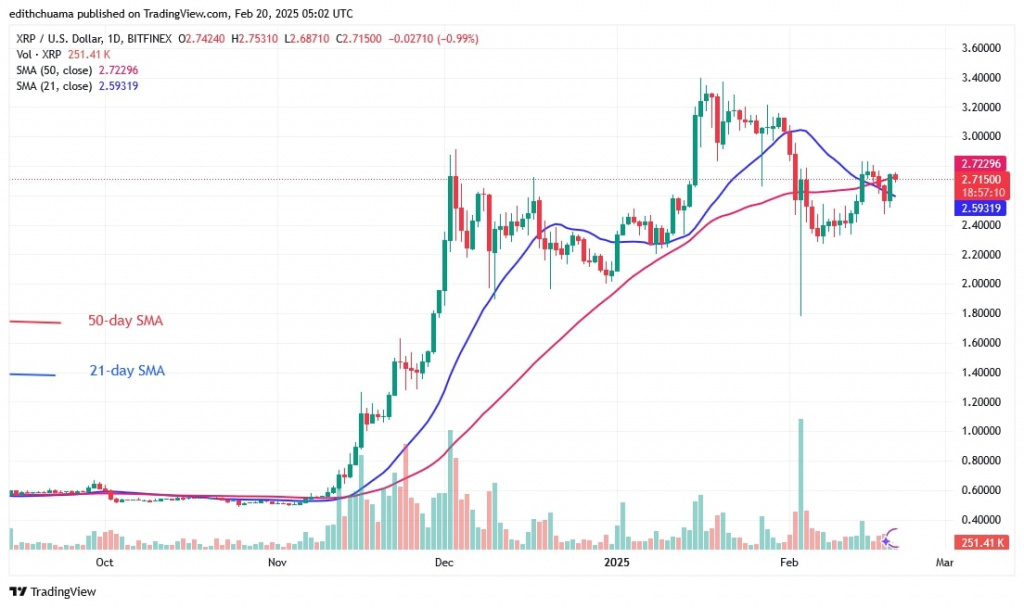
On February 14, the bulls pushed the price above the moving averages but were stopped by the bears. Today, the bulls and bears are still fighting above the moving average lines to take over the price. If the buyers hold the price above the moving average lines, XRP will rise to the previous highs and is expected to reach the highs of $3.21 and $3.40.
However, if XRP turns down from the moving average lines, it will re-enter a trading range and move below the average lines but above the $2.20 support, as Coinidol.com reports.
XRP indicator analysis
The price has fallen below the 50-day SMA. If the altcoin holds above the 21-day SMA support, XRP will be trapped between the moving average lines.
Technical indicators:
Resistance Levels – $2.80 and $3.00
Support Levels – $1.80 and $1.60
What is the next direction for XRP?
The cryptocurrency is moving sideways, oscillating between support at $2.20 and resistance at $2.80. The bulls have already been beaten back three times from the $2.80 high. XRP is falling towards the middle of the price range. The price action is characterized by doji candlesticks as it stays within its range.

Disclaimer. This analysis and forecast are the personal opinions of the author. They are not a recommendation to buy or sell cryptocurrency and should not be viewed as an endorsement by Coin Idol. Readers should do their research before investing in funds.


