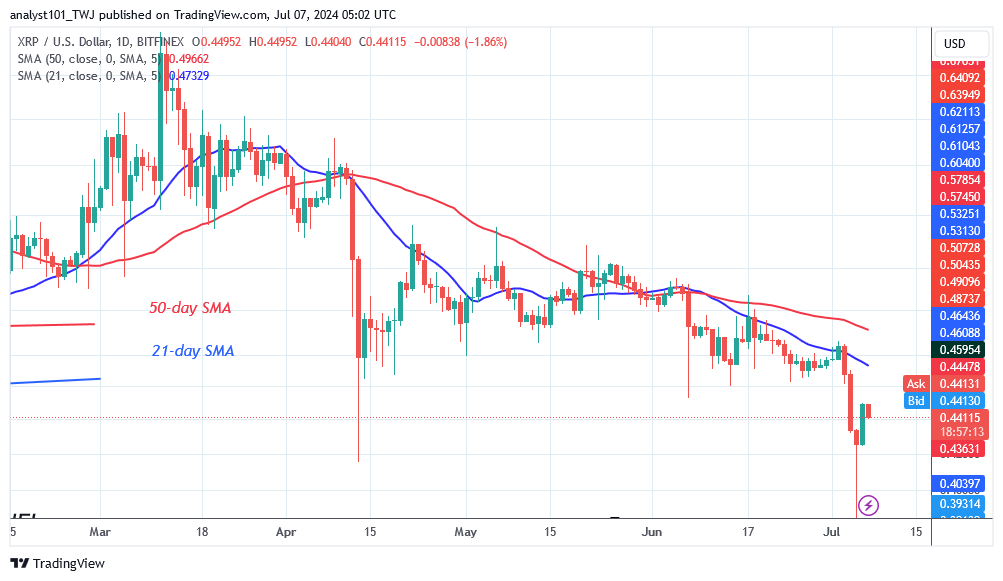
The price of Ripple (XRP) has continued to fall, reaching a low of $0.38. Cryptocurrency price analysis brought by Coinidol.com.
XRP long term analysis: bearish
The cryptocurrency has lost its current support at the previous lows of $0.46 and $0.41. The bulls, on the other hand, benefited from altcoin’s upward correction. The upward correction has stalled at the $0.45 resistance level. If the current resistance level is maintained, the price of the altcoin will fluctuate between $0.38 and $0.45. Meanwhile, XRP is trading in the oversold territory of the market. If the bears break through the resistance level at $0.45, the uptrend will resume. Moreover, XRP will drop to a low of $0.30 if the support at $0.38 is broken. XRP is now worth $0.44.
XRP indicator analysis
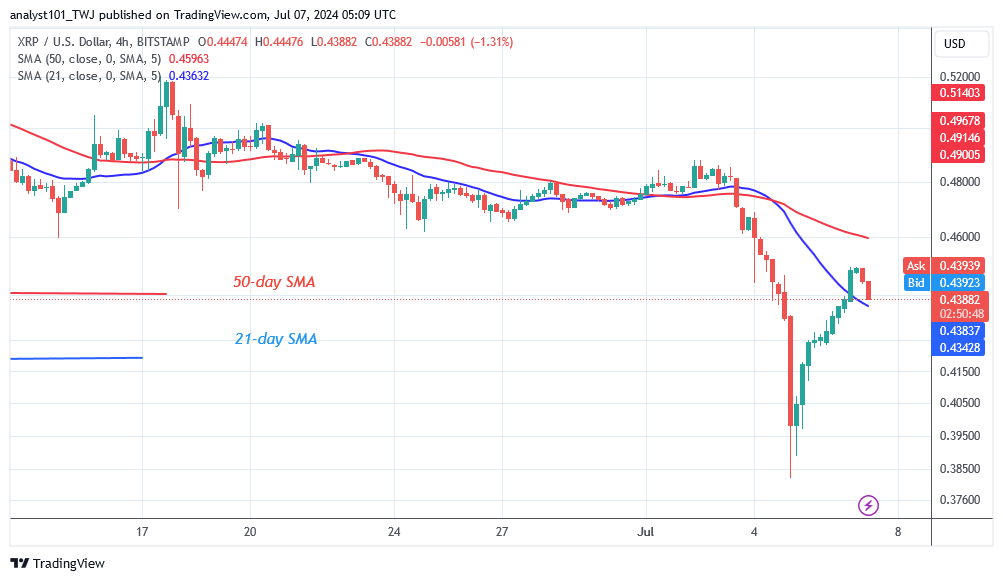
The price bars are below the moving average lines and the extended candle tail points to the $0.38 support. There is strong buying pressure near the $0.38 support level. On the 4-hour chart, the price of the cryptocurrency has risen between the moving average lines.XRP will be forced into an area between the moving average lines.

Technical indicators:
Key resistance levels – $0.80 and $1.00
Key support levels – $0.40 and $0.20
What is the next direction for XRP?
XRP is now trading at the bottom of the chart. The altcoin has fallen below the previous low at $0.41. XRP is currently trading in a new price range of $0.38 to $0.46. The altcoin is also trading between the moving averages at the bottom of the chart.

Disclaimer. This analysis and forecast are the personal opinions of the author and are not a recommendation to buy or sell cryptocurrency and should not be viewed as an endorsement by CoinIdol.com. Readers should do their research before investing.


