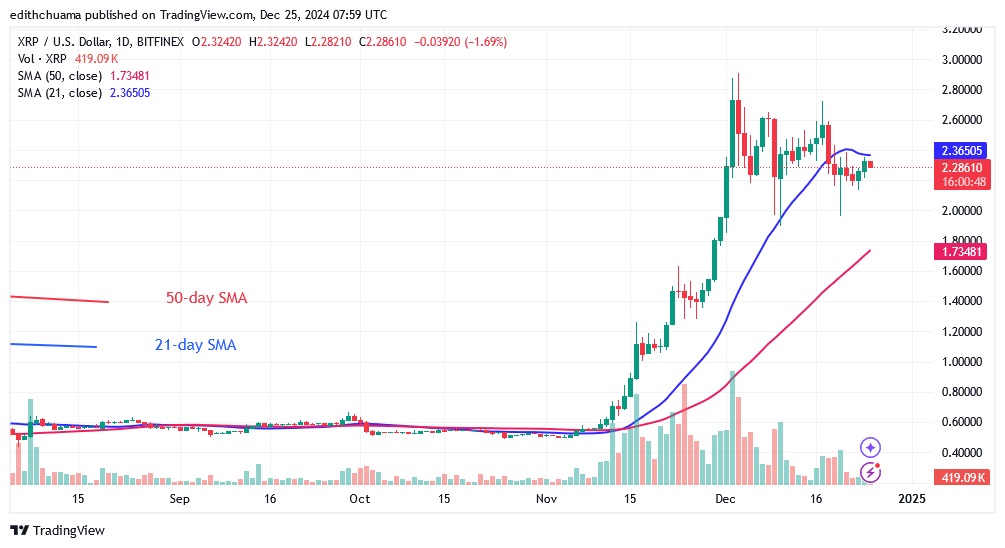
The Ripple (XRP) price has broken below the 21-day SMA support and made a low above $2.00. Cryptocurrency price analysis brought by Coinidol.com.
XRP long-term analysis: ranging
The cryptocurrency has slipped further between the moving average lines. The altcoin is trading below the 21-day SMA resistance but above the 50-day SMA support. Buyers are trying to keep the price above the 21-day simple moving average to continue the uptrend. If the buyers prevail, XRP will rally to its previous high of $2.80. However, selling pressure will return if XRP fails at the resistance of the 21-day SMA. On the downside, XRP will fall above its current support of $2.00. The downside momentum will continue to the low above the 50-day SMA support. Meanwhile, XRP will remain stuck below the 21-day SMA barrier.
XRP indicator analysis
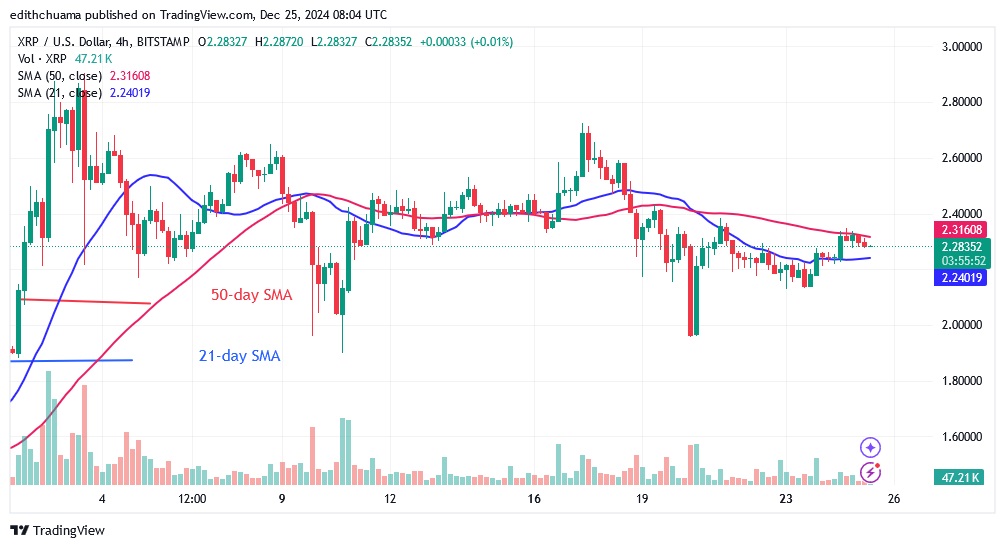
Since December 19, XRP has fallen below its 21-day SMA support. Further upward movement of the coin is unlikely. The altcoin is expected to fall above its 50-day SMA support. On the 4-hour chart, the price bars are located between the moving average lines. This means that the altcoin is forced to move within a limited range.

Technical indicators:
Key resistance levels – $1.40 and $1.60
Key support levels – $1.00 and $0.80
What is the next direction for XRP?
The bullish momentum has been halted by the 50-day SMA resistance. The altcoin is trading between the moving average lines and doji candlesticks are forming.

Disclaimer. This analysis and forecast are the personal opinions of the author and are not a recommendation to buy or sell cryptocurrency and should not be viewed as an endorsement by CoinIdol.com. Readers should do their research before investing.


