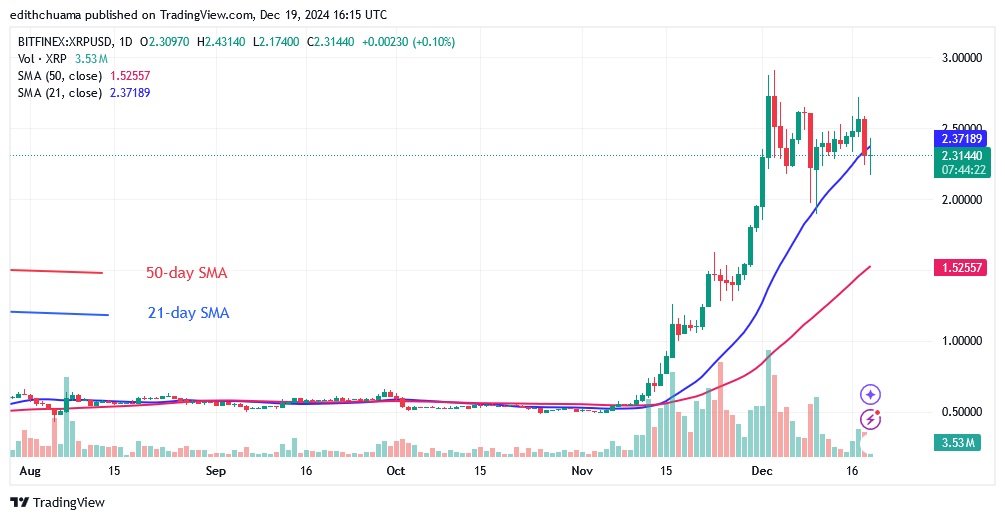
Cryptocurrency analysts of Coinidol.com report, Ripple (XRP) price is moving sideways, above the moving average lines but below the $2.80 resistance.
XRP long term analysis: fluctuation range
Bulls and bears disagree on the direction of the market. On December 18, the bears broke through the 21-day SMA support while the bulls bought the dips. The price of the cryptocurrency has fallen below the 21-day SMA while the buyers are trying to push it back above the 21-day SMA. If the negative momentum continues, XRP will drop to the next support above the 50-day SMA or the low of $1.52. If the altcoin recovers and breaks above the 21-day SMA, the uptrend will continue to the previous high of $2.80. In the meantime, XRP has fallen to $2.31 at the time of writing.
XRP indicator analysis
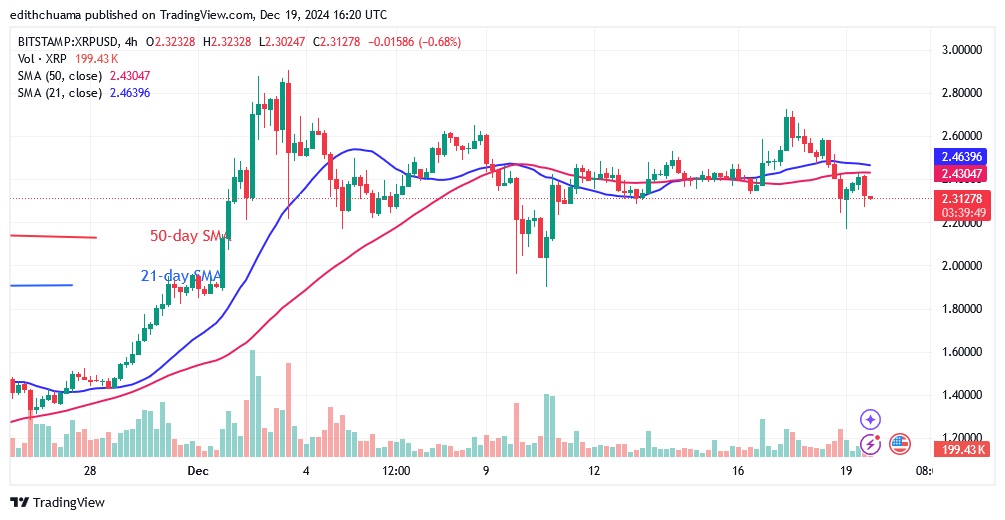
The 21-day and 50-day SMAs are trending upwards, reflecting the ongoing uptrend. However, as the trend has stalled on the 4-hour chart, the moving average lines have become horizontal. The price bars appear above and below the sloping moving average lines. The price activity is dominated by small, indecisive candles, the so-called doji.

Technical indicators:
Key resistance levels – $1.40 and $1.60
Key support levels – $1.00 and $0.80
What is the next direction for XRP?
On the 4-hour chart, XRP is in a sideways trend after the end of the uptrend on December 2. XRP is oscillating above the $2.20 support and below the $2.60 resistance. The price bars have broken below the moving average lines as the altcoin consolidates above its current support.

Disclaimer. This analysis and forecast are the personal opinions of the author and are not a recommendation to buy or sell cryptocurrency and should not be viewed as an endorsement by CoinIdol.com. Readers should do their research before investing.


