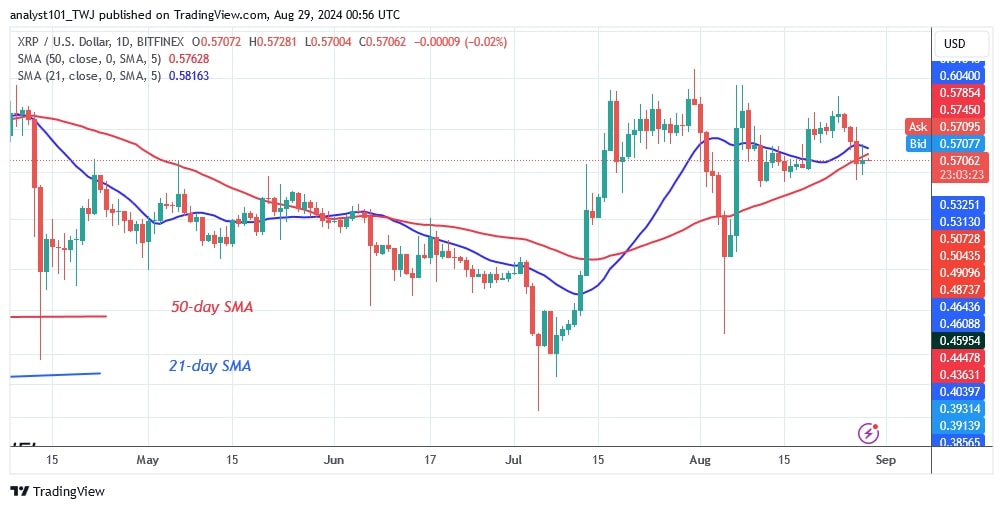
The price of XRP (XRP) continues to trend sideways although it has dipped below the moving average lines.
XRP long-term analysis: ranging
Since July 17, buyers have been trying to break through the $0.64 mark, but have not succeeded. Today, sellers have gained the upper hand and driven the price below the moving average lines. At the time of writing, XRP has fallen to a low of $0.55. The altcoin is set to fall further, reaching a low of $0.48.
On the downside, the currency could fall, although it has returned above the $0.48 support level since August 5 as reported by Coinidol.com.
On the upside, XRP will rise if it finds support above its low of $0.48. The altcoin is currently trading in a range between the $0.48 support and the $0.64 resistance.
XRP indicator analysis
XRP has slipped below the moving average lines after being rejected at the $0.64 resistance level. The altcoin will fall as long as the price bars remain below the moving average lines. The range-bound move could continue if the doji candlesticks materialize.
Technical indicators:
Resistance Levels – $0.80 and $1.00
Support Levels – $0.40 and $0.20
What is the next direction for XRP?
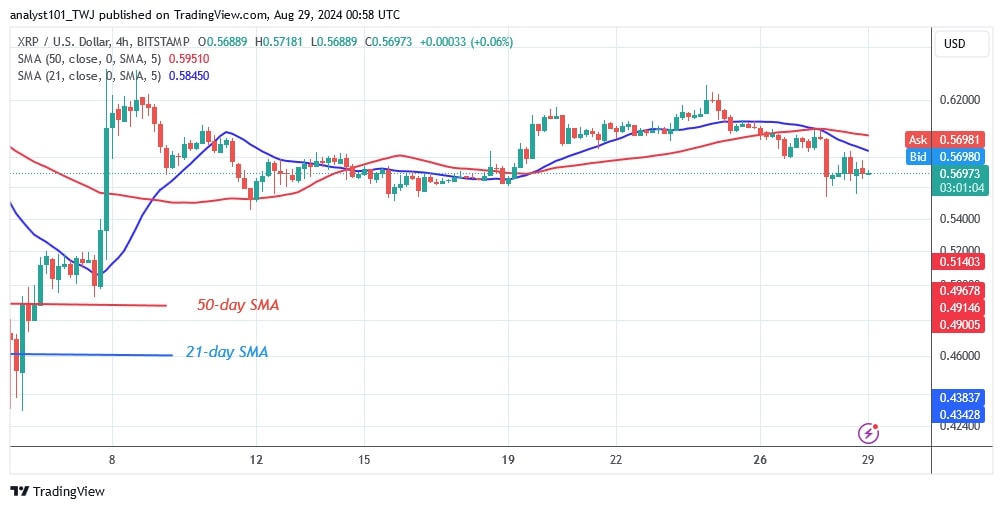
On the 4-hour chart, XRP is moving sideways after hitting the $0.64 level. The price of the altcoin is hovering between $0.50 and $0.64. The price activity has been dominated by Doji candlesticks, which slow down price movement.

Disclaimer. This analysis and forecast are the personal opinions of the author. They are not a recommendation to buy or sell cryptocurrency and should not be viewed as an endorsement by CoinIdol.com. Readers should do their research before investing in funds.


