The price of Ripple (XRP) has fallen, reaching a low of $0.45 before recovering. Ripple coin analysis by Coinidol.com.
Long-term analysis of XRP: ranging
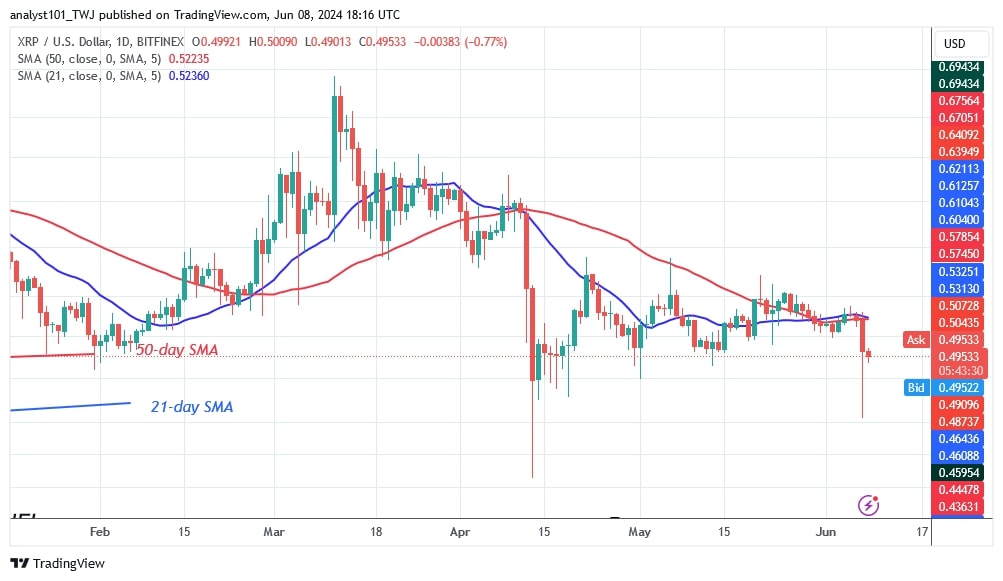
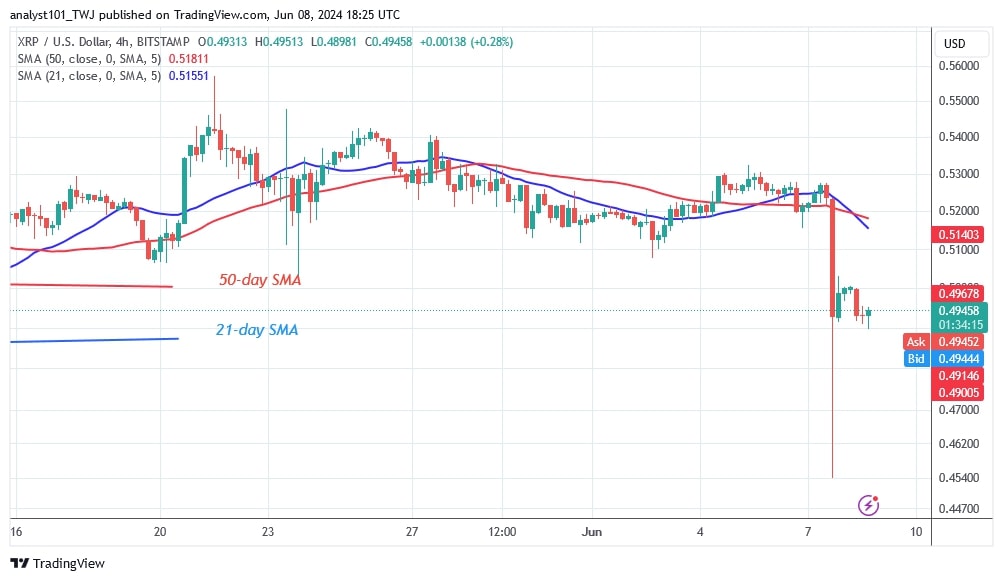
The cryptocurrency has returned to its range after the downturn. The price of the altcoin is hovering between $0.46 and $0.54. Today, the altcoin has fallen and is hovering just above the support level of $0.49.
If XRP remains at the low of $0.49, it will resume its movement within the limited range. Further depreciation of the cryptocurrency is unlikely as the altcoin has remained above the support level of $0.49 since April 17. On the upside, the altcoin will resume a positive trend if it breaks above the moving average lines. XRP is worth $0.49 at the time of writing.
XRP indicator analysis
After the price breakout, the price bars have fallen well below the moving average lines. The bulls have stopped the slide above the $0.49 support. The candlesticks have long tails, indicating significant buying pressure at lower price levels.
Technical indicators:
Key resistance levels – $0.80 and $1.00
Key support levels – $0.40 and $0.20
What is the next direction for XRP?
On the 4-hour chart, the altcoin is bearish and is in a sideways trend. The price of the altcoin is hovering between $0.49 and $0.54. On May 13, the altcoin established support above the existing support level and resumed its uptrend.
Disclaimer. This analysis and forecast are the personal opinions of the author and are not a recommendation to buy or sell cryptocurrency and should not be viewed as an endorsement by CoinIdol.com. Readers should do their research before investing in funds.


