The price of XRP (XRP) is consolidating above the $0.54 support after falling below the moving average lines recently. Price analysis by Coinidol.com.
Long-term XRP price forecast: bearish
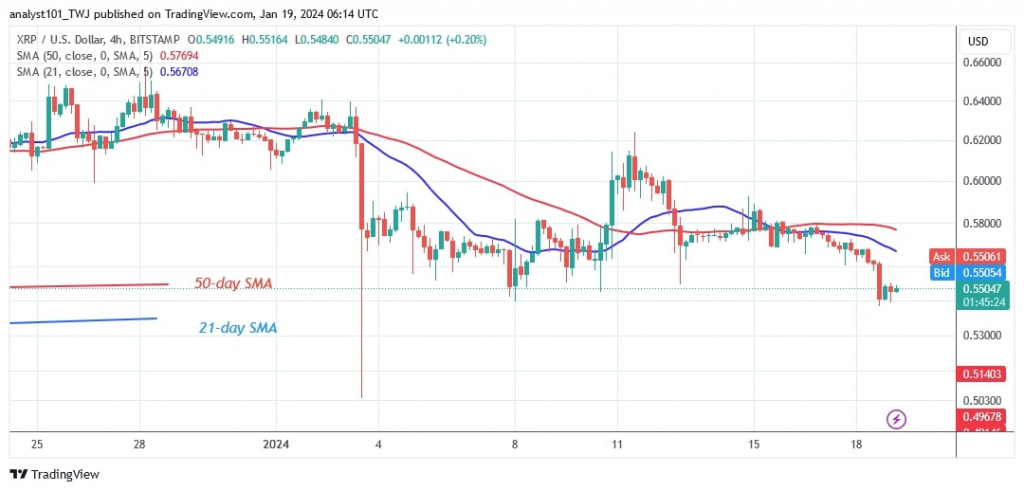
Selling pressure has eased above the $0.54 support as buyers defend the current support. The decline has stopped as the cryptocurrency bounces every time it retests the $0.54 support.
In other words, XRP is trading in a narrow range between $0.54 and $0.58. Currently, the upside is being held back by resistance at $0.58 or the moving average lines. In general, price action is dominated by doji candlesticks. These candlesticks indicate that buyers and sellers are undecided about the direction of the market. However, if the current support at $0.54 is broken by the bears, the altcoin will reach the previous low of $0.48 again.
XRP indicator analysis
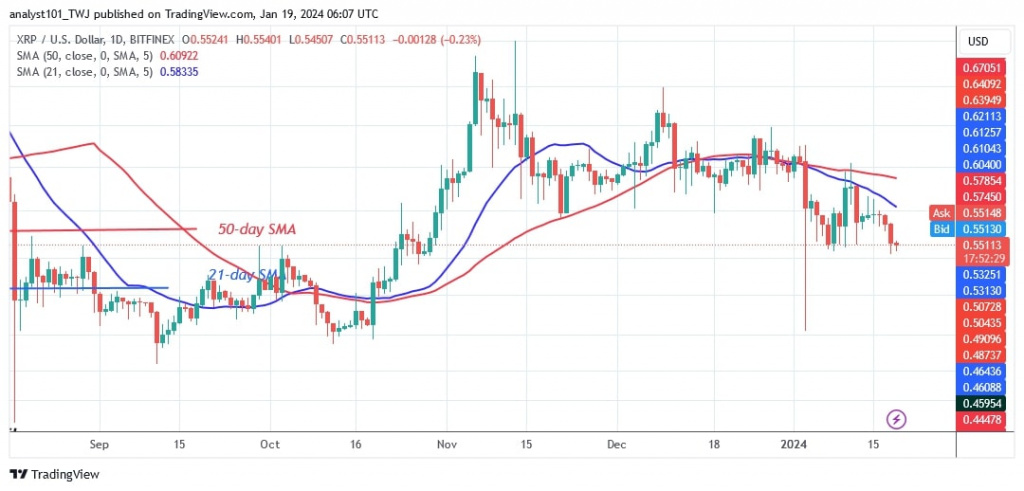
The price bars containing the doji candlesticks are below the moving average lines. Selling pressure, which is expected to continue, has eased above the $0.54 support. The moving average lines are sloping horizontally, which is due to the break of the uptrend on November 6, 2023.
Technical indicators:
Key resistance levels – $0.80 and $1.00
Key support levels – $0.40 and $0.20
What is the next move for XRP?
XRP is trading above the $0.54 support as sellers try to resume selling pressure. Doji candlesticks are limiting the downside move in prices. Moreover, the long candlestick tail indicates strong selling pressure at the bottom of the chart. A further downward movement of the cryptocurrency is doubtful.

Disclaimer. This analysis and forecast are the personal opinions of the author and are not a recommendation to buy or sell cryptocurrency and should not be viewed as an endorsement by CoinIdol.com. Readers should do the research before investing in funds.


