- Optimism price has flashed a buy signal on the three-day chart.
- If Bitcoin’s bullish outlook sustains in the long term, OP could witness a 40% rally.
- A flip of the range low at $0.877 into a resistance level on the three-day timeframe will invalidate the bullish theiss.
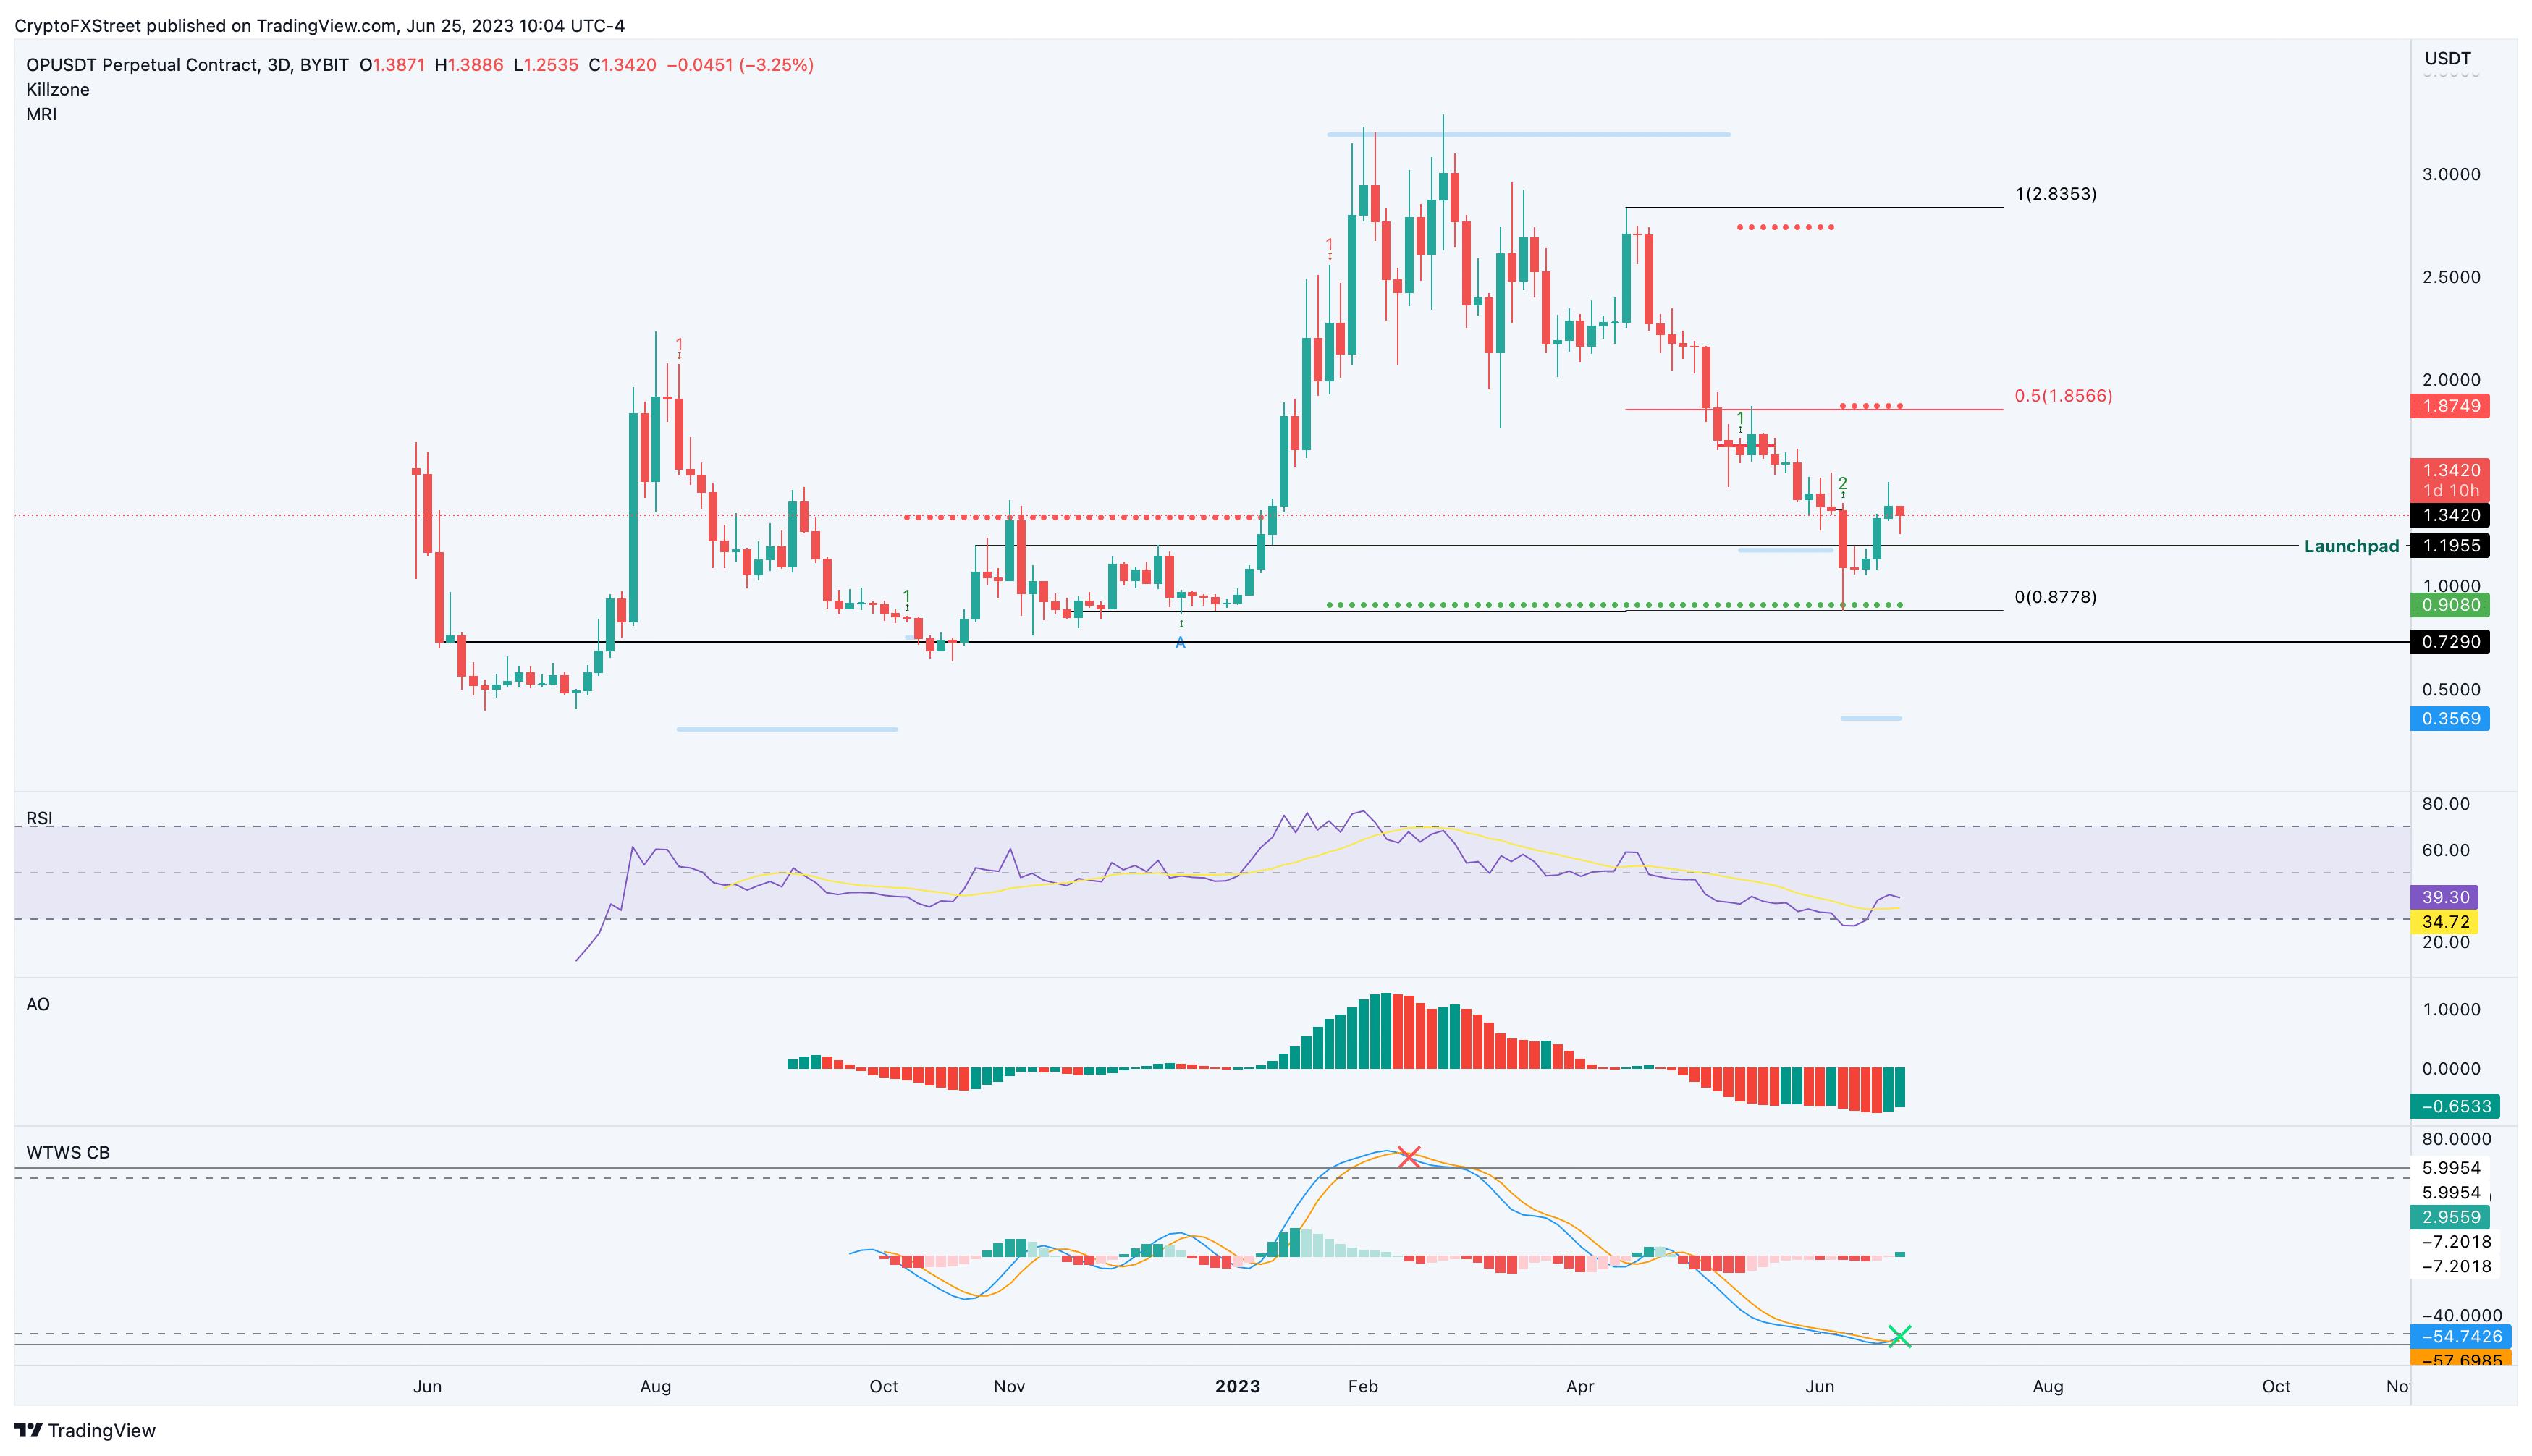
Optimism price shows some interesting developments on the three-day chart. The buy signal generated by the Wave Trend indicator, combined with the MRI’s second buy signal that spawned on June 9, suggests that OP could be due for a high timeframe trend reversal.
Also read: Ethereum Layer 2 Optimism beats MATIC to the curb, sees massive spike in active addresses
Optimism price prepares for another explosive run-up
Optimism price shot up 272% between December 2022 and February 2023. This impressive run-up set up an all-time high at $3.289. Soon thereafter, OP bears took over, triggering a correction so brutal that it undid all the gains in the next 105 days.
The Momentum Reversal Indicator (MRI) flashed two buy signals during this descent on May 13 and June 9. After the second buy signal, Optimism price rallied 38% in the next nine days. The Layer 2 token currently trades at $1.327, which is roughly 50% from the local bottom at $0.877.
The Relative Strength Index has dipped below the oversold zone and has recovered, indicating a resurgence of bullish momentum as sidelined buyers step in to accumulate OP tokens. The same can be seen in the Awesome Oscillator indicator, which shows a decline in bearish momentum via the shift in histograms from red to green.
Lastly, the Wave Trend indicator has flashed a buy signal under the oversold region, making it the best time to accumulate OP. To add to this bullishness, Optimism price currently sits above the $1.195 support level, which is critical in kickstarting OP’s bull rally.
OP/USDT 3-day chart
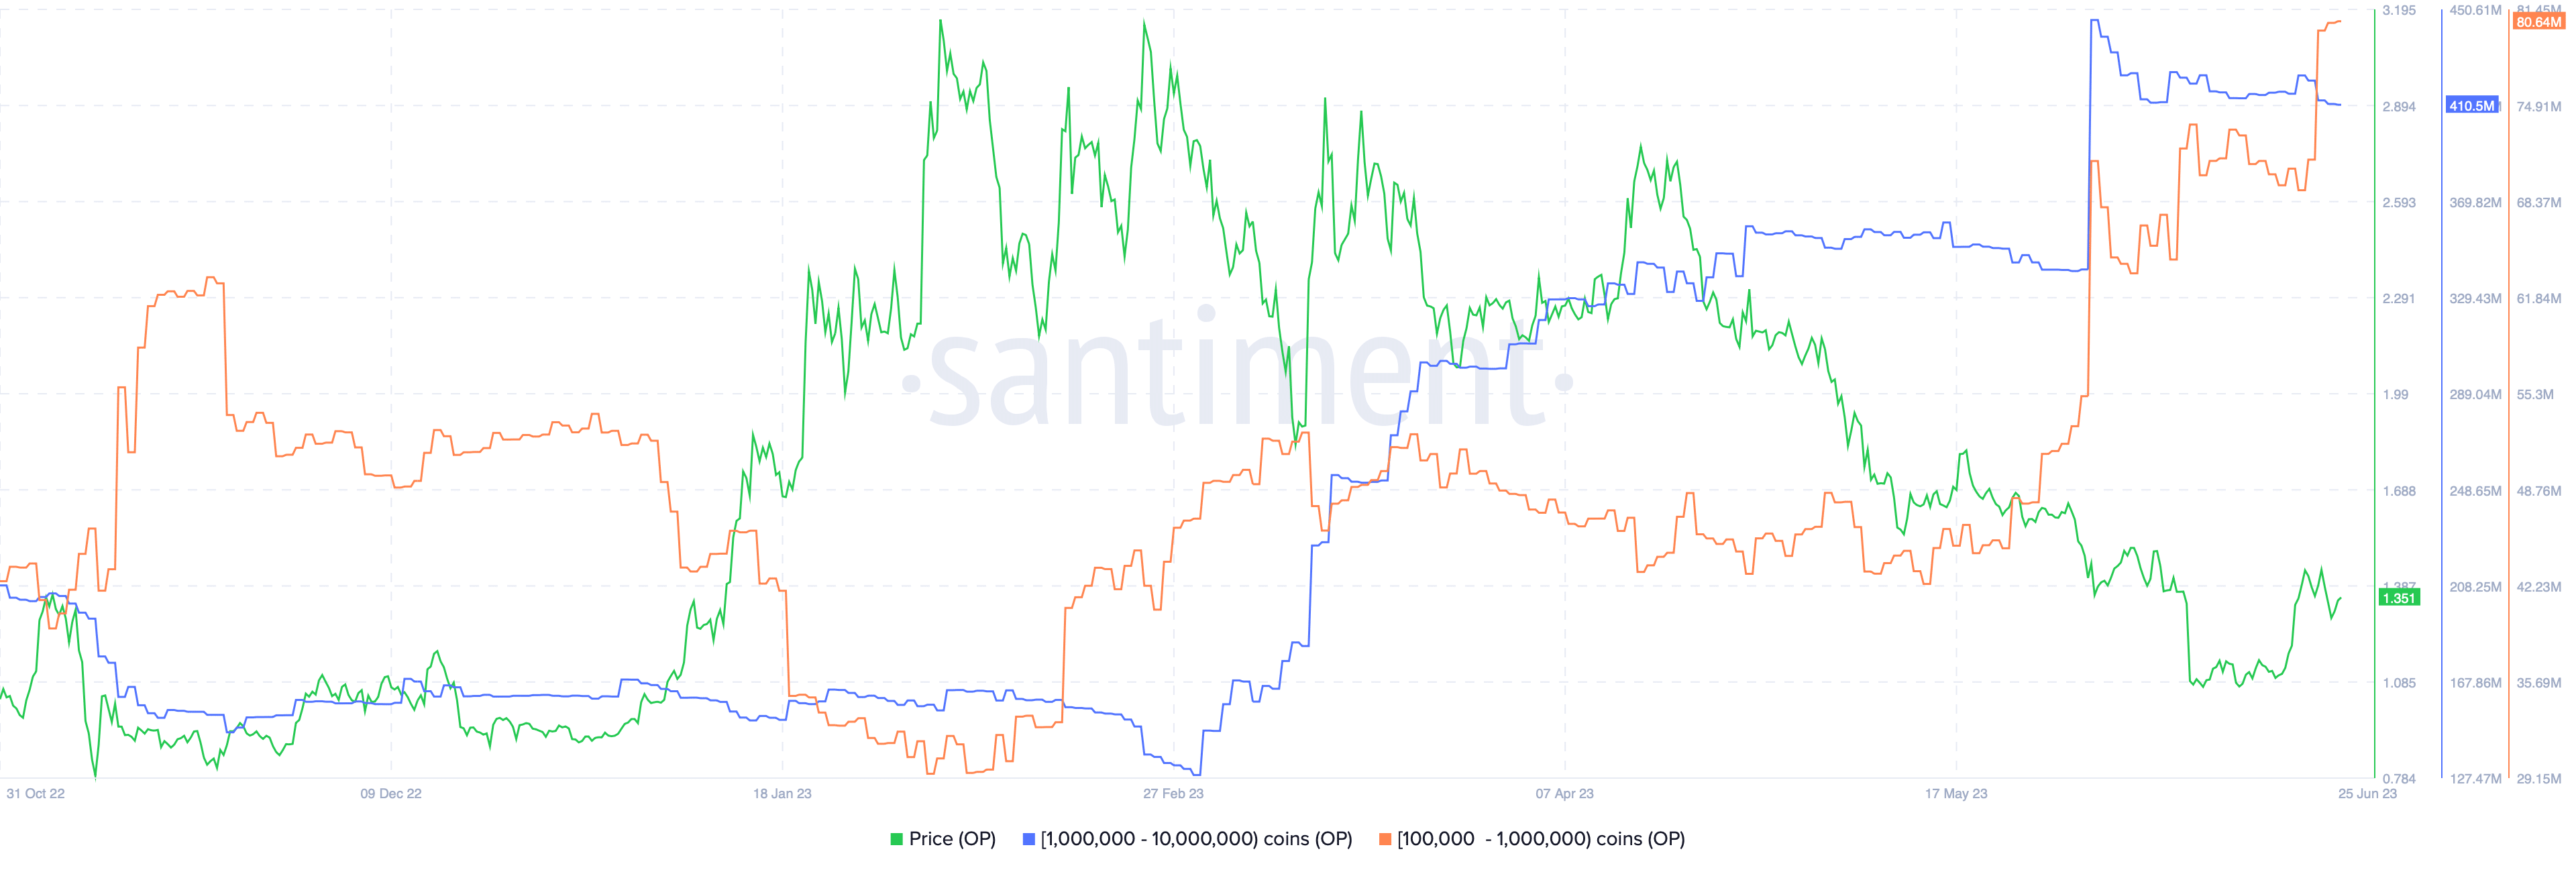
Furthermore, whales holding between 100,000 and 1,000,000 OP tokens seem to have been accumulating since May 22. Roughly 35.85 million whales joined this category in the last month. Additionally, whales holding between 1,000,000 to 10,000,000 OP tokens have also increased from 341 million on May 30 to 410 on June 25.
Due to the massive scale of these whales’ accumulation spree, it could be a hint that Optimism price might be primed for a rally.
OP Supply Distribution chart
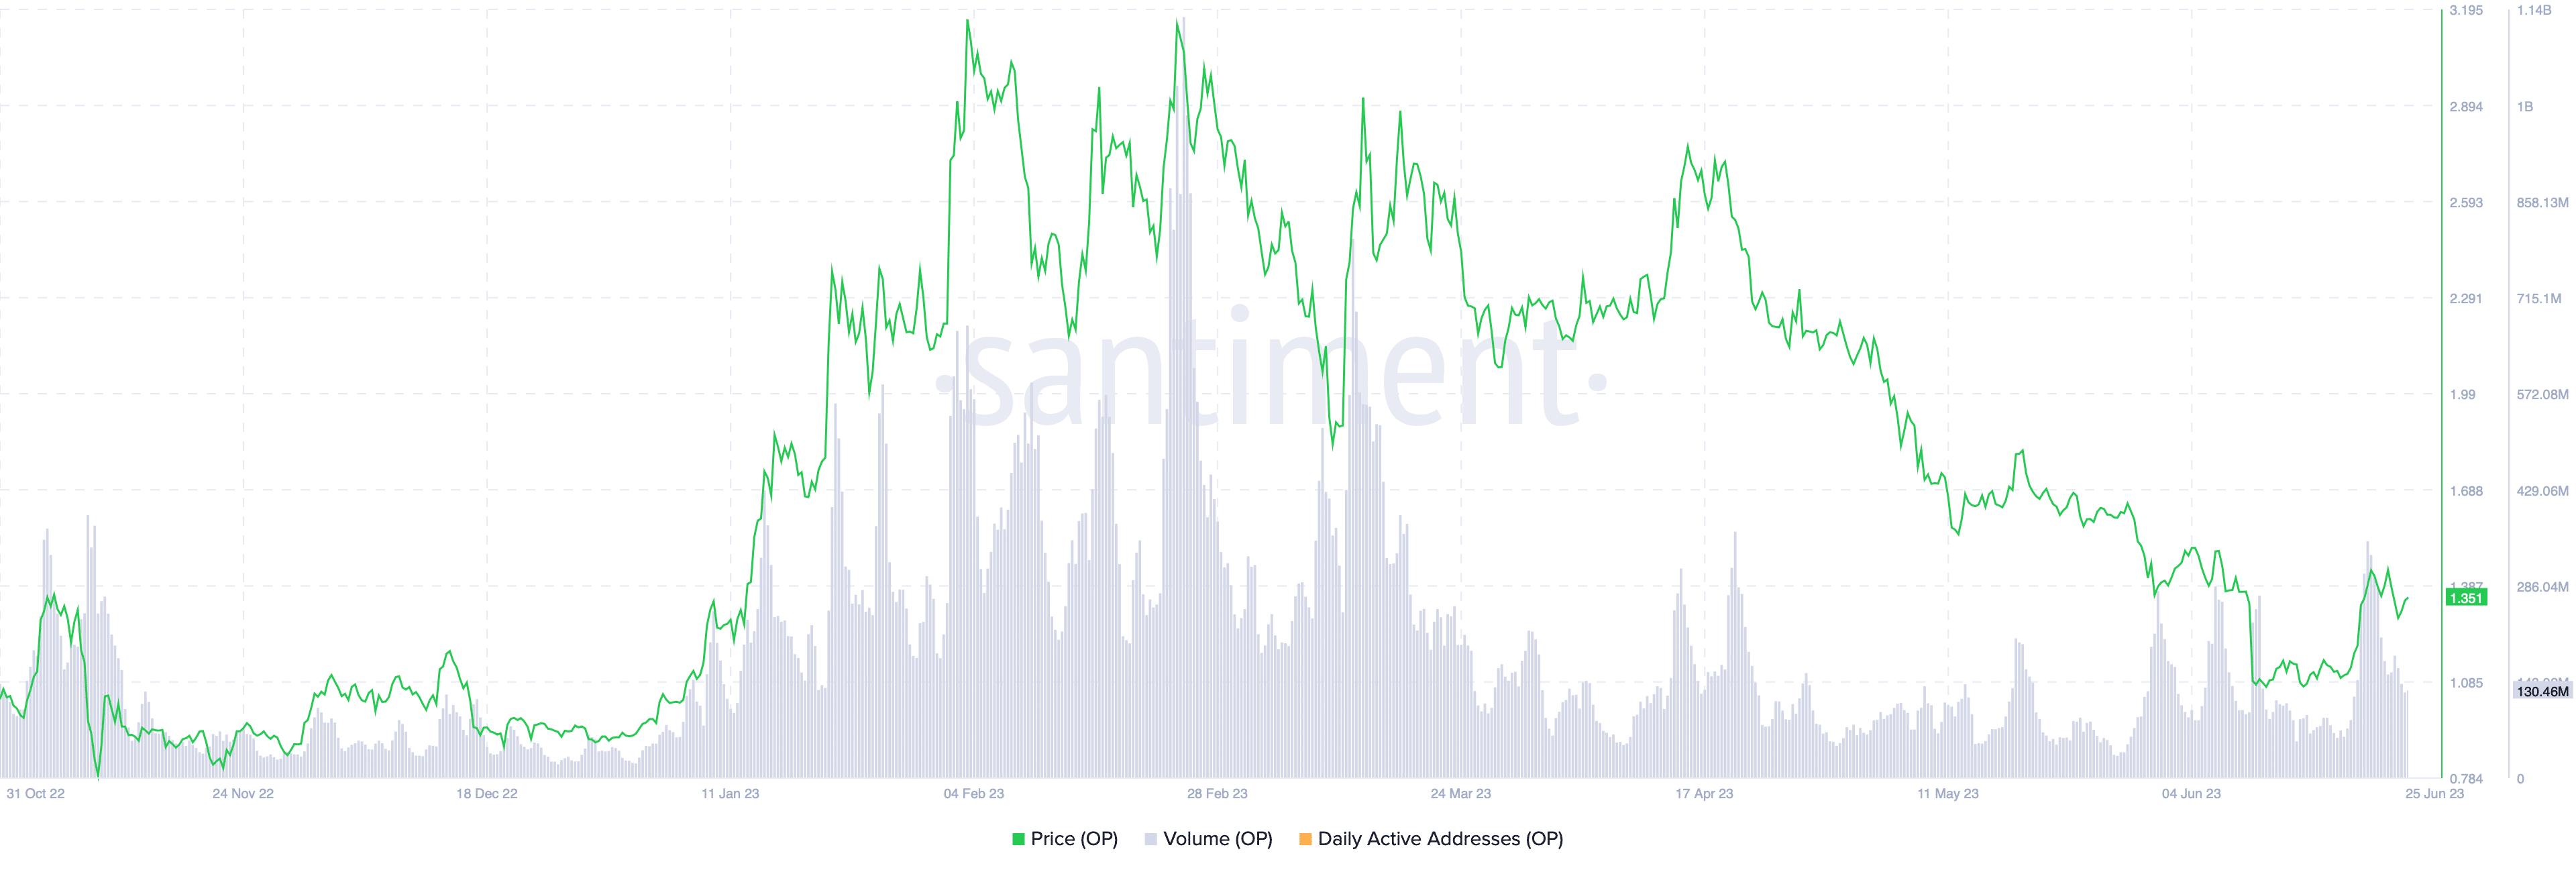
The accumulation from high net-worth investors can be confirmed by a consistent increase in on-chain volume. As seen in the chart below, there are three higher highs, suggesting an increased activity from these high net-worth investors.
OP On-chain Volume chart
While the bullish outlook can be confirmed from both a technical and on-chain perspective, investors need to be careful of Bitcoin. A sudden spike in bearish volume that knocks BTC lower could have a similar effect on altcoins, including OP.
If Optimism price flips the range low at $0.877 into a resistance level on the three-day timeframe, it will invalidate the bullish theiss by producing a lower low. This move could skew the odds in bears’ favor and potentially trigger a correction to the immediate support level at $0.729.


