The altcoins listed below are the underperforming cryptocurrencies. The altcoins are in a horizontal trend after exhausting the bearish momentum. Other cryptocurrencies rallied when the bulls broke above the moving average lines.
Starknet
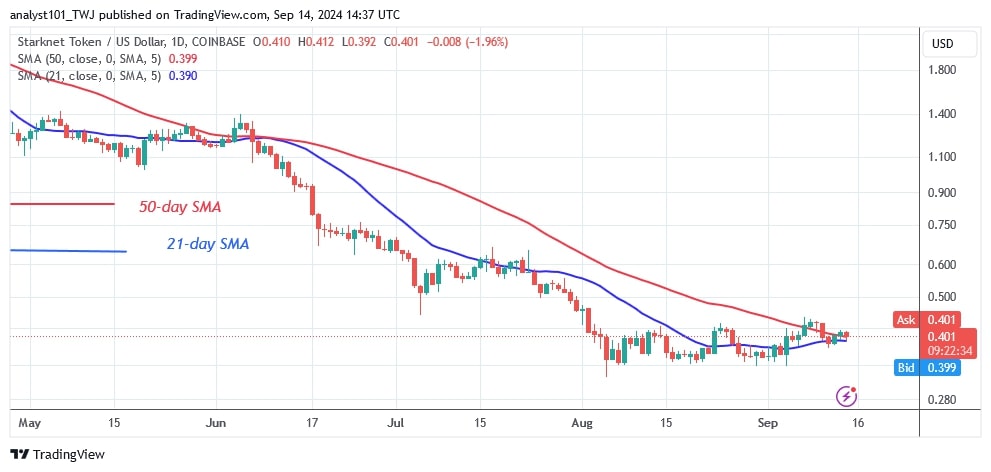
Starknet (STRK) is in a downtrend and has fallen to the bottom of the charts.
On August 5, the cryptocurrency fell from a high of $2.78 to a low of $0.317. The bulls have stopped the slide and the altcoin is trading between $0.31 and $0.45. While the trend is being determined, the altcoin is consolidating within a narrow range. The altcoin will resume its uptrend if buyers keep the price above the $0.45 resistance level. A further slide of the cryptocurrency is unlikely as the market has reached an overbought level. The altcoin is the worst performing cryptocurrency. It has the following characteristics:
The current price: $0.4013
Market capitalization: $4,013,503,938
Trading volume: $37,634,058
7-day loss percentage: 9.10%
Helium
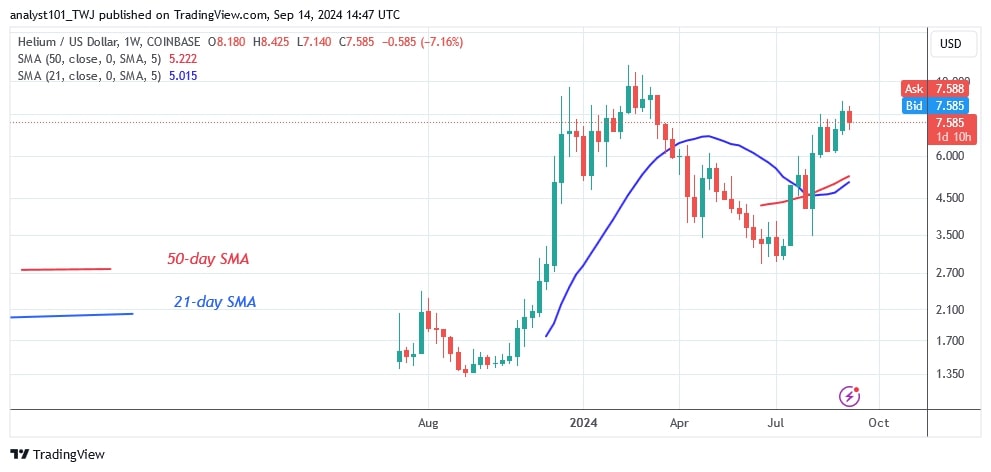
Helium (HNT) was previously in a downtrend, but is now in an upward correction. The cryptocurrency fell to a low of $2.90 before recovering. The altcoin has risen above the moving average lines and has reached a high of $7.00. Buyers are expected to drive the altcoin to the previous high of $11.16. The altcoin has reached the high of $8 but is fluctuating below it. The upward movement is characterized by doji candlesticks that slow down the price movement. The altcoin’s decline has made it the second worst performing coin. It has the following characteristics:
The current price: $7.47
Market capitalization: $1,202,764,565
Trading volume: $20,783,928
7-day loss percentage: 7.10%
Arweave
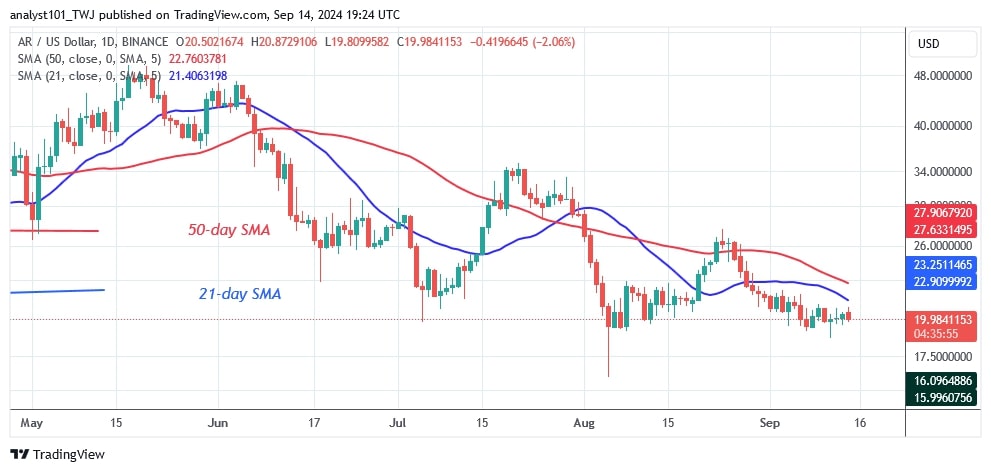
Arweave (AR) is currently in a downtrend, reaching a low of $16 on August 5. The cryptocurrency value has been declining since reaching the overhead resistance at $50. The bearish momentum has faded after reaching the low of $16. The bulls have halted the downtrend above $19. Currently, the altcoin is trading sideways, above the $18 support but below the $28 resistance.
On the upside, the altcoin will continue a positive trend until the price breaks above the moving average lines or the $28 mark. AR falls as it retests the lower price area. AR is the third worst performing coin based on these parameters.
The current price: $19.39
Market Capitalization: $1,279,899,732
Trading Volume: $37,798,637
7–day Loss: 2.94%
TRON
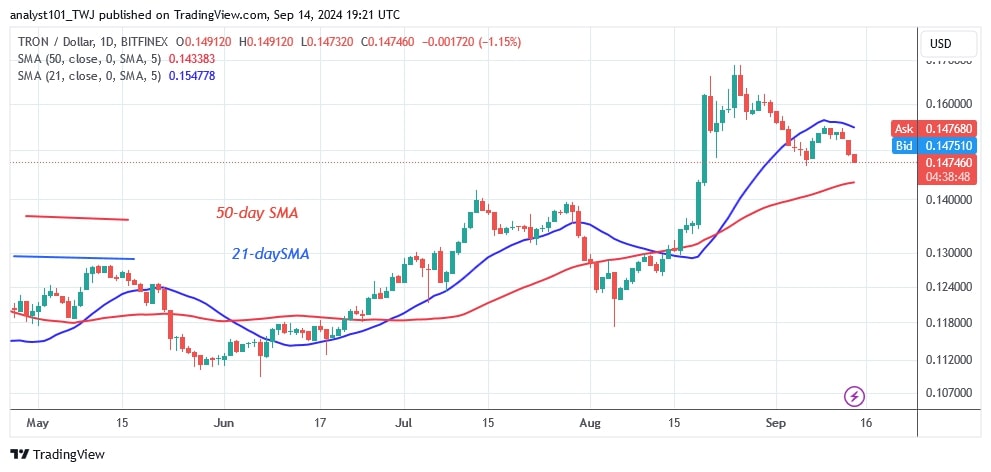
TRON (TRX) is declining after ending the uptrend at a high of $0.168. The cryptocurrency has lost value and fallen below the 21-day SMA. TRON is currently trading above the 50-day SMA but below the 21-day SMA. The altcoin is currently worth $0.148 and is between the moving average lines. If the bears break the 50-day SMA support, the altcoin would drop further to a low of $0.124. On the other hand, if the buyers hold the price above the 21-day SMA, TRON will return to its previous high of $0.168.This is the fourth worst performing cryptocurrency. Here are a few critical components.
Current price: $0.1484
Market Capitalization: $12.867.730.565
Trading volume: $230,414,875
7–day gain/loss: 2.49%
Monero
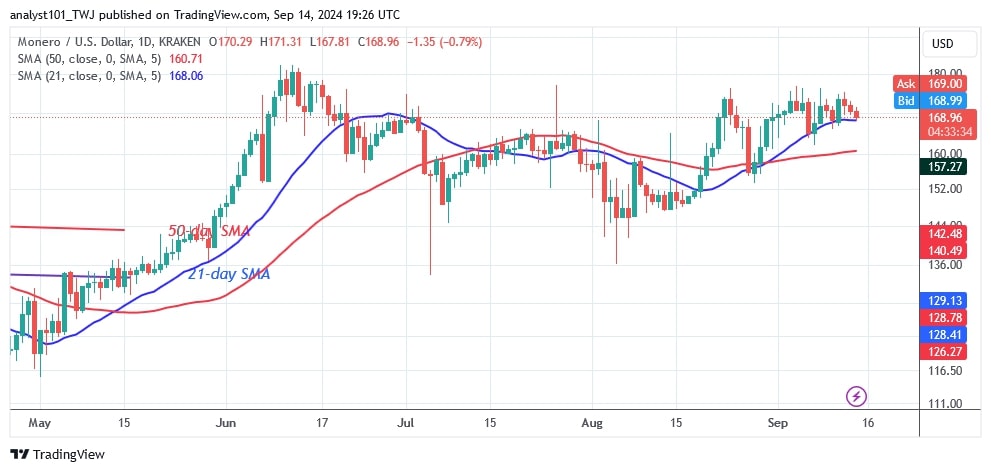
The price of Monero (XMR) has been in a sideways trend since the end of the rally on June 12. The upswing came to a halt at a high of $182 and the market began to drift sideways. It is currently trading within a range of $145 to $180. The crypto price has risen above its moving average lines. However, the increasing momentum is still below the $180 barrier and if the bulls fail to break above the $180 level, the sideways trend will continue. The crypto price has stabilized above the 21-day SMA support. XMR is the fifth worst performing cryptocurrency. It has the following characteristics:
Current price: $170.40
Market capitalization: $3,143,376,072
Trading volume: $43,865,643
7–day loss: 0.56%
Disclaimer. This analysis and forecast are the personal opinions of the author. They are not a recommendation to buy or sell cryptocurrency and should not be viewed as an endorsement by CoinIdol.com. Readers should do their research before investing in funds.


