TRON (TRX) price tested the recent high twice before breaking above the moving average lines.
The altcoin is trading in the overbought zone of the market. More details in this cryptocurrency price analysis by Coinidol.com.
TRON (TRX) price long-term prediction: bullish
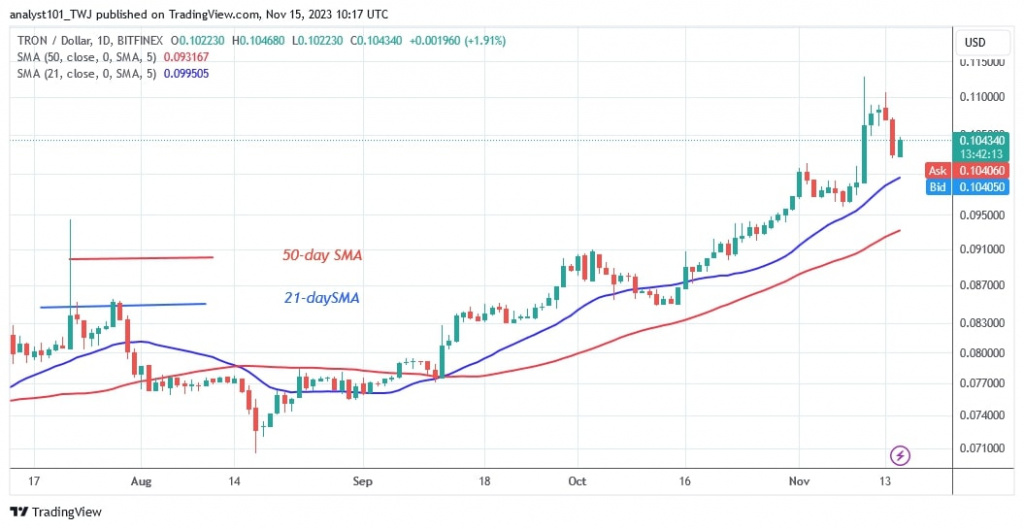
The price of TRON (TRX) has temporarily paused its uptrend after reaching a high of $0.11 on November 11.
It is currently oscillating between the price levels of $0.10 and $0.11. If the bulls break through the resistance at $0.11, the market will rise to a high of $0.13. However, the uptrend is shaky due to the overbought status of the cryptocurrency. TRON is at risk of a decline if the bears fall below the support level of $0.09 or the moving average lines. The decline will continue until the price reaches the low of $0.08.
TRON (TRX) indicator reading
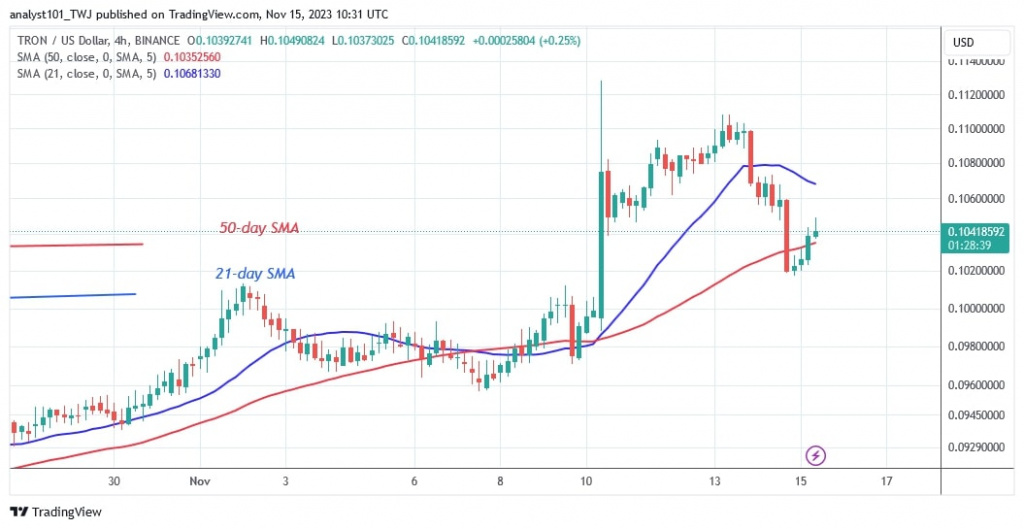
The current uptrend is indicated by the upward moving average lines. However, when the uptrend ended at the recent high of $0.11, the moving average lines moved sideways. On the 4-hour chart, the price of the cryptocurrency is currently trapped between the moving average lines.TRON will continue to move sideways for a few more days.
Technical indicators
Key Supply Zones: $0.07, $0.08, $0.09
Key Demand zones: $0.06, $0.05, $0.04
What is the next direction for TRON?
TRX/USD has been trading since the uptrend was halted on November 10. Over the past five days, TRON has been confined to a range. Buyers are struggling to resume an uptrend above the $0.11 high as the cryptocurrency remains above the $0.10 support.
TRON (TRX) value has been declining since November 1 after reaching a high of $0.10.

Disclaimer. This analysis and forecast are the personal opinions of the author and are not a recommendation to buy or sell cryptocurrency and should not be viewed as an endorsement by CoinIdol.com. Readers should do their research before investing in funds.


