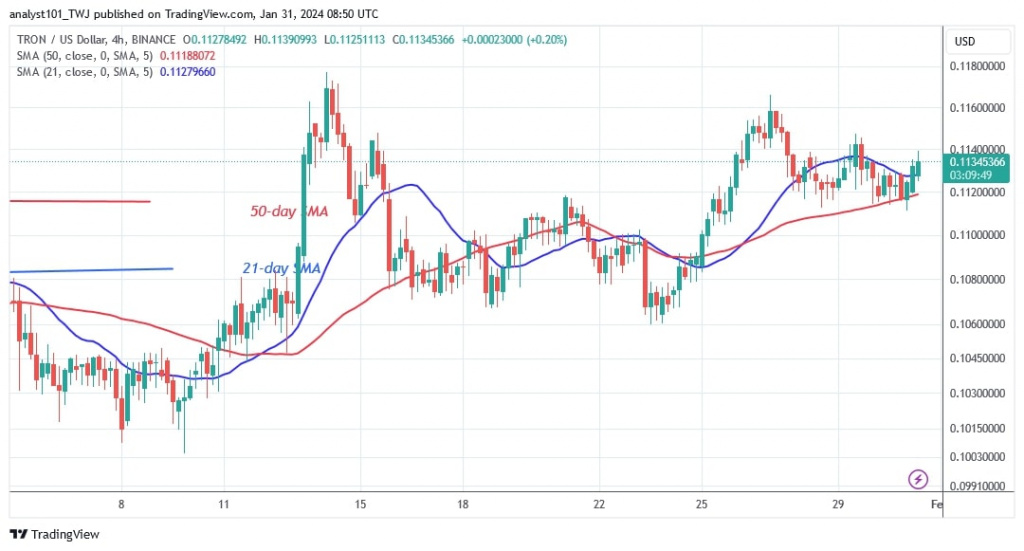
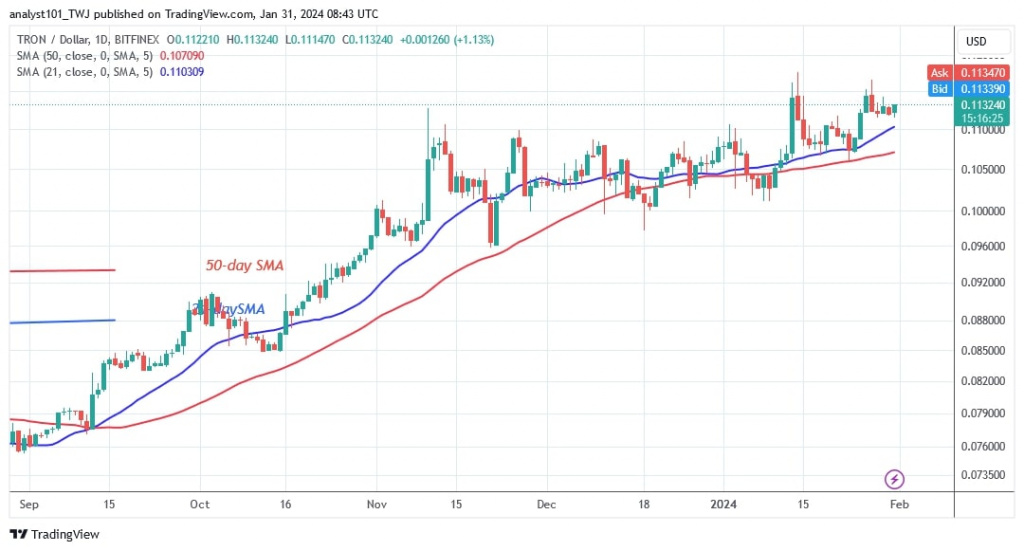
The price of TRON (TRX) has held above the moving average lines but below the $0.1150 resistance level. Coinidol.com bringing cryptocurrency price analysis.
Long-term forecast for the TRON price: fluctuating
Since January 13, 2024, buyers have failed to maintain positive momentum above the overhead resistance. The cryptocurrency has slipped above the moving average lines and pushed the bulls back from the barrier level twice. The altcoin has risen after retracing above the moving average lines.
If the bulls break the barrier at $0.1150, the market will rally to a high of $0.14. However, if the upper resistance is not broken, the sideways trend will certainly continue. TRON will fall if the bulls fail to sustain their bullish momentum above the moving average lines. TRON is now worth $0.112.
TRON indicator reading
TRON is in an uptrend, with price bars above the moving average lines since January 13. The moving average lines show a continuous northward slope, indicating an uptrend. The price action has consolidated many doji candlesticks, slowing the price action.
Technical indicators
Key supply zones: $0.09, $0.10, $0.11
Key demand zones: $0.06, $0.05, $0.04
What is the next direction for TRON?
TRON is in a sideways trend but remains above the moving average lines. The bulls have failed to sustain their bullish momentum despite testing resistance twice in the last two weeks. In addition, the presence of doji candlesticks has limited price movement.

January 24, 2024 Coinidol.com reported that TRON broke above the 21-day SMA or low at $0.107. The sideways trend was predicted to continue upwards if the existing support holds.
Disclaimer. This analysis and forecast are the personal opinions of the author and are not a recommendation to buy or sell cryptocurrency and should not be viewed as an endorsement by CoinIdol.com. Readers should do their research before investing in funds.


