The price of TRON (TRX) is above the moving average but below the new high of $0.126. TRON price analysis by Coinidol.com.
Long-term forecast for the TRON price: bullish
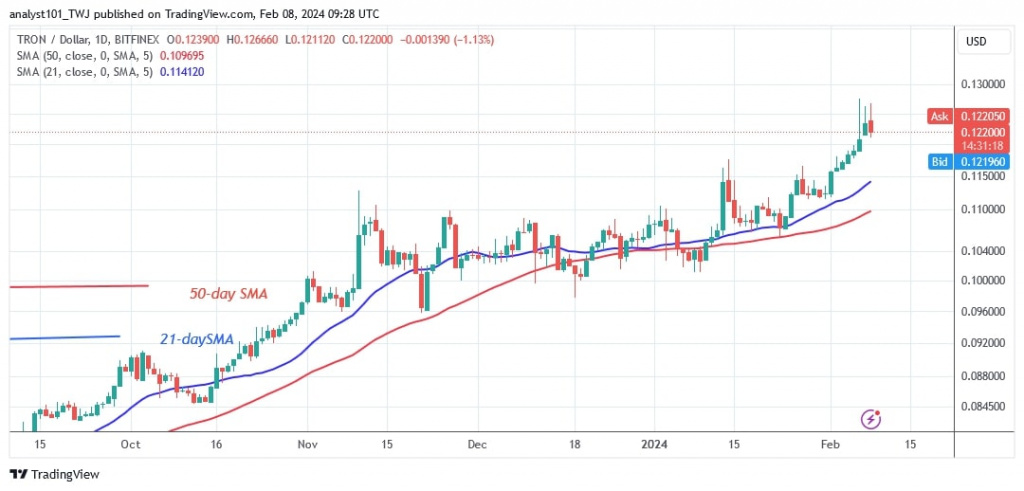
On February 1, the cryptocurrency regained momentum and broke through the $0.111 support level. After a third retest, the buyers broke through the resistance at $0.115.
TRON is now trading at $0.122. The price of the cryptocurrency is declining after reaching a new high of $0.12. The current uptrend will continue if the price retraces and stays above the breakout level of $0.115. The altcoin will rise and challenge the resistance level at $0.126. TRON will rise to a high of $0.14 if buyers break through the current resistance level. If the bulls fail to break the current high, TRON will fall and settle between $0.115 and $0.126.
TRON indicator reading
The current market upswing has pushed the price bars above the moving average lines. This indicates that the cryptocurrency will continue to rise in value. The moving average lines are consistently trending north. There are three candlesticks with long wicks at the recent high, indicating significant selling pressure at $0.125.
Technical indicators
Key supply zones: $0.09, $0.10, $0.11
Key demand zones: $0.06, $0.05, $0.04
What is the next direction for TRON?
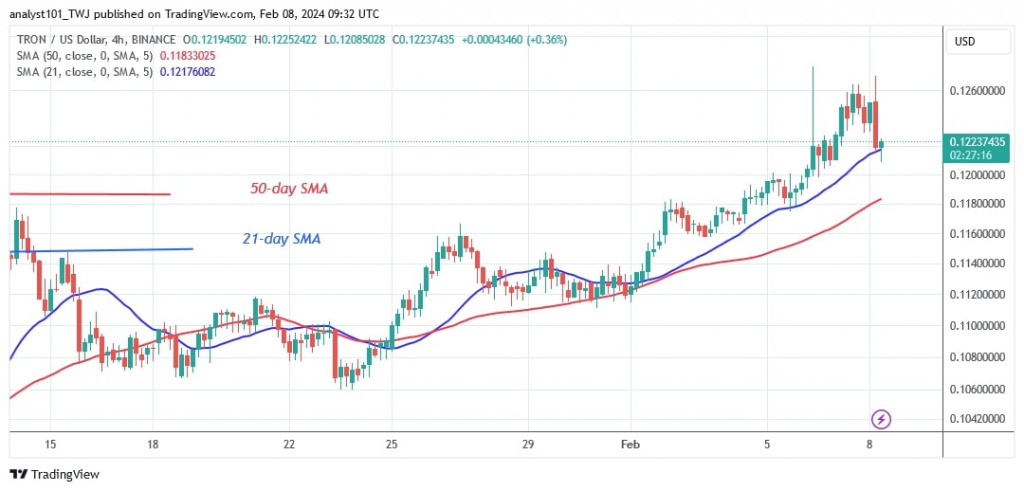
On the 4-hour chart, TRON is in a steady uptrend. The altcoin has pulled back above the moving average lines after encountering resistance at $0.126. The current uptrend will continue if the altcoin stays above the 21-day SMA. The bullish momentum has started and the altcoin is holding above the moving average lines.

Disclaimer. This analysis and forecast are the personal opinions of the author and are not a recommendation to buy or sell cryptocurrency and should not be viewed as an endorsement by CoinIdol.com. Readers should do their research before investing in funds.


