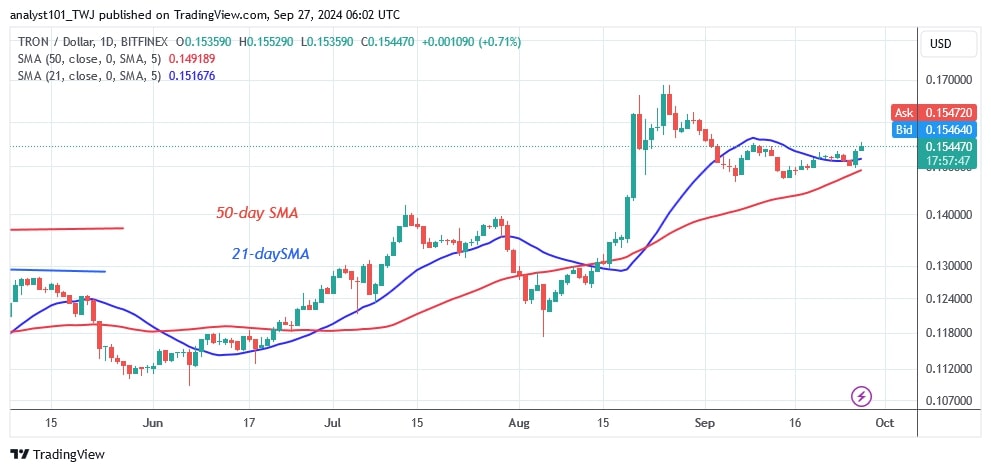
The price of TRON (TRX) is in an uptrend but is currently moving sideways below the $0.17 resistance level.
During the previous rally, buyers were unable to sustain the bullish momentum above the $0.17 resistance level.
TRON was pushed back after reaching the resistance zone twice. The altcoin fell below the 21-day SMA and was trapped between the moving average lines for two weeks.
Long-term TRON price forecast: bullish
Today, TRON has regained bullish momentum and has risen above the 21-day moving average line. The cryptocurrency is now worth $0.154. If the positive momentum continues, the altcoin will rise to a high of $0.16. However, the upward movement will face stiff resistance at the high of $0.17.
TRX indicator analysis
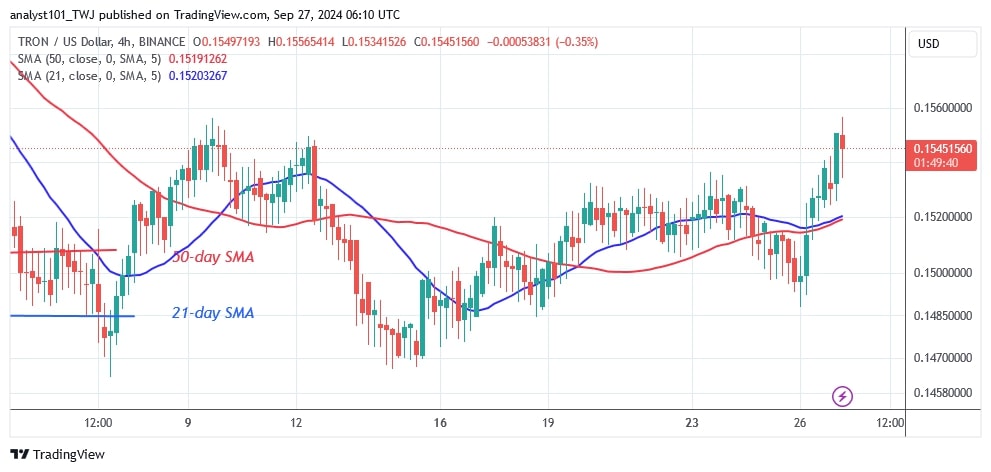
TRON is trading in the positive trend zone after rising above the 21-day SMA. The altcoin will gain value if the price bars move above the moving average lines. Doji candlesticks characterize the price behavior of cryptocurrencies. Both charts show bullish crosses between the moving average lines, which indicate the rise of the cryptocurrency.
Technical Indicators
Key Resistance Zones: $0.13, $0.14, and $0.15
Key Support Zones: $0.10, $0.09, and $0.08
What is the next move for TRON?
TRON is trading sideways and is below the resistance level of $0.156. In other words, the price of the altcoin is moving between $0.147 and $0.156. However, the doji candlesticks have slowed down the price movement. The trend will resume if the buyers keep the price above the $0.17 resistance level.

Coinidol.com wrote on September 20 that over the past two weeks, the altcoin has remained within the moving average lines, but it has risen to retest the 21-day SMA resistance.
Disclaimer. This analysis and forecast are the personal opinions of the author. They are not a recommendation to buy or sell cryptocurrency and should not be viewed as an endorsement by CoinIdol.com. Readers should do their research before investing in funds.


