The price of TRON (TRX) is rising, reaching a high of $0.14. Price analysis by Coinidol.com.
Long-term forecast for the TRON price: bullish
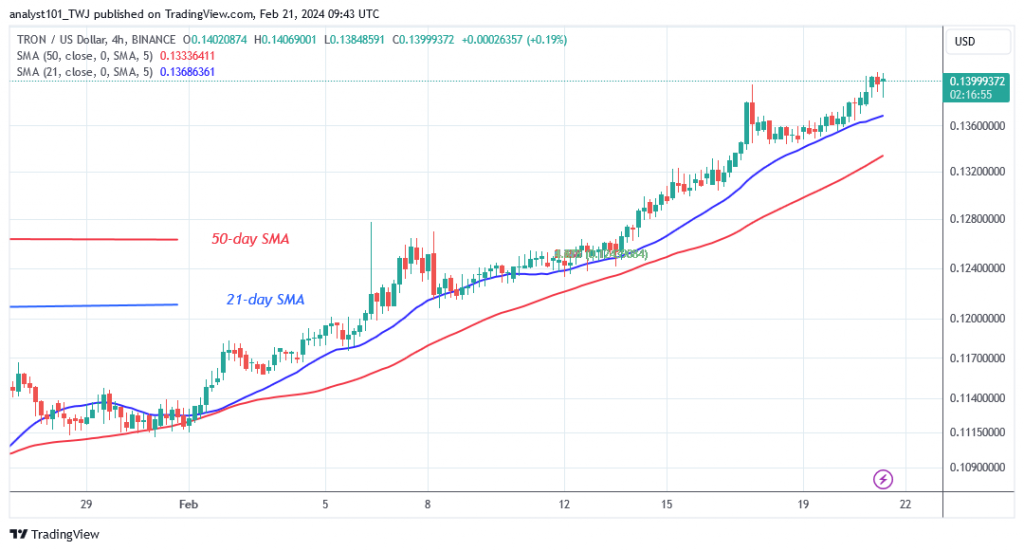
On February 17, 2024, the altcoin was sold off when it reached the $0.14 resistance zone. TRON resumed its uptrend after retracing above the 21-day moving average line.
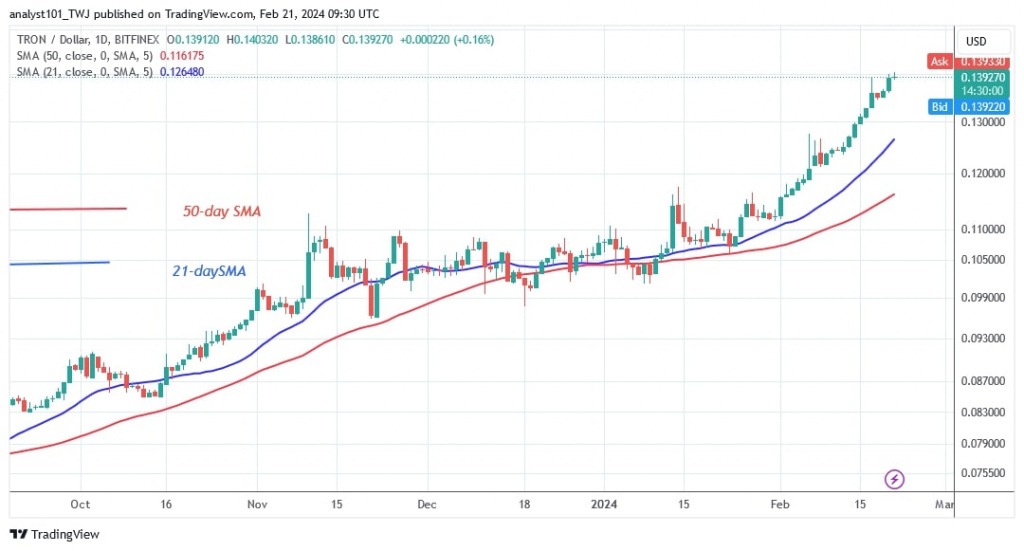
Today, the price of the cryptocurrency is testing the $0.14 barrier. The current rise has been halted at the $0.14 resistance level since February 20, 2024. If buyers break through the resistance at $0.14, the market will reach a high of $0.1488. Meanwhile, the altcoin is trading at $0.1386.
TRON indicator display
The TRON price bars are above the moving average lines and above the 21-day SMA, which serves as a support line. The altcoin will bounce and rise each time it retests the moving average support line. If the support line is broken, the altcoin will fall.
Technical indicators
Key supply zones: $0.09, $0.10, $0.11
Key demand zones: $0.06, $0.05, $0.04
What is the next direction for TRON?
TRON’s upward movement has been continuous, reaching a high of $0.14. On the 4-hour chart, the recent high was retested twice but rejected. TRON is trending down towards the moving average lines. The current uptrend will continue if the price retraces and stays above the 21-day $MA. The current uptrend will end if the moving average lines are broken.

Disclaimer. This analysis and forecast are the personal opinions of the author and are not a recommendation to buy or sell cryptocurrency and should not be viewed as an endorsement by CoinIdol.com. Readers should do their research before investing in funds.


