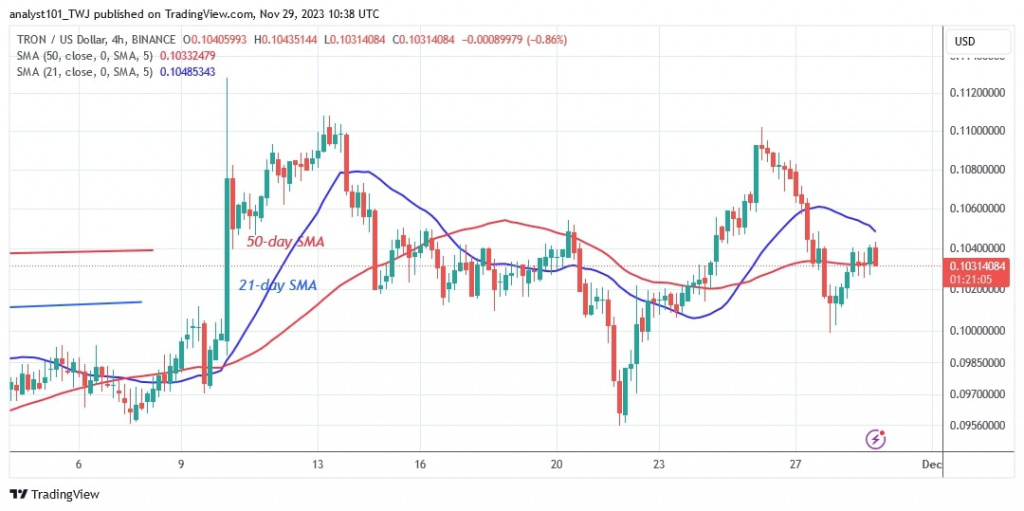
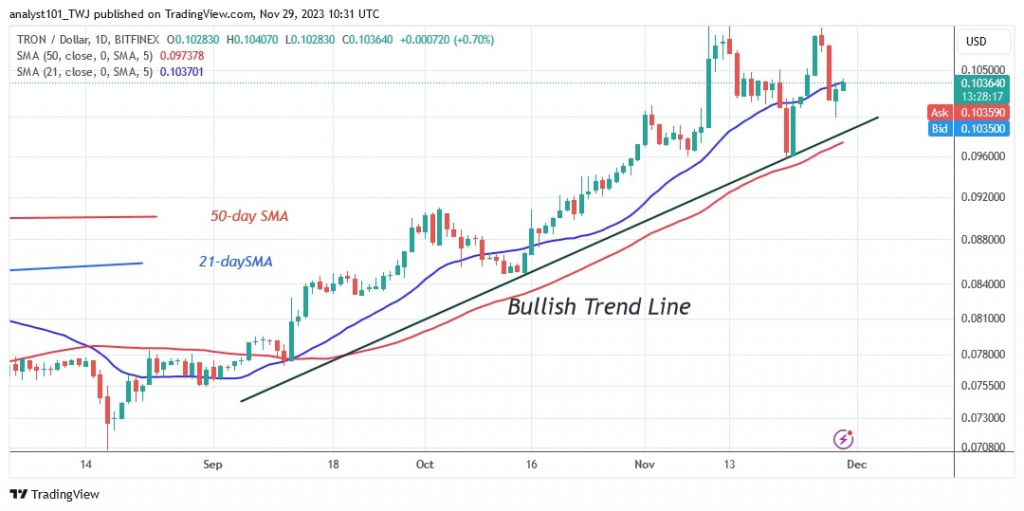
The price of TRON (TRX) has fallen below the 21-day moving average line twice.
Long-term forecast for the TRON price: bearish
The cryptocurrency reached a high of $0.11 twice, but failed to break above this level. After the recent dip, TRON is now trading between the moving average lines. If buyers keep the price above the 21-day SMA, the uptrend could resume. It is unlikely that the price action will continue above the recent high. On the downside, the downtrend will continue if the bears drop below the 50-day SMA. The market will then drop to $0.091.
TRON indicator reading
After the decline, the price bars are now between the moving average lines. For a few days, the price of the cryptocurrency will fluctuate between the moving average lines. The moving average lines are sloping upwards, indicating an upward trend. The moving average lines on the 4-hour chart are sloping horizontally, indicating a sideways trend.
Technical indicators
Key supply Zones: $0.07, $0.08, $0.09
Key demand zones: $0.06, $0.05, $0.04
What is the next direction for TRON?
TRON has reached the overbought zone of the market. The altcoin risks a crash if the bears fall below the 50-day simple moving average on the daily chart. Since November 10, the current rise has come to an end. This is due to the cryptocurrency’s overbought zone.
Last week Coinidol.com reported that TRON was trading above the support level of $0.096. The uptrend encounters a first resistance at the high of $0.10.

Disclaimer. This analysis and forecast are the personal opinions of the author and are not a recommendation to buy or sell cryptocurrency and should not be viewed as an endorsement by CoinIdol.com. Readers should do the research before investing in funds.


