The price of TRON (TRX) will remain stable in the coming days. Price recovery or decline will dictate the rise and fall of the cryptocurrency.
TRON price long term prediction: in the range
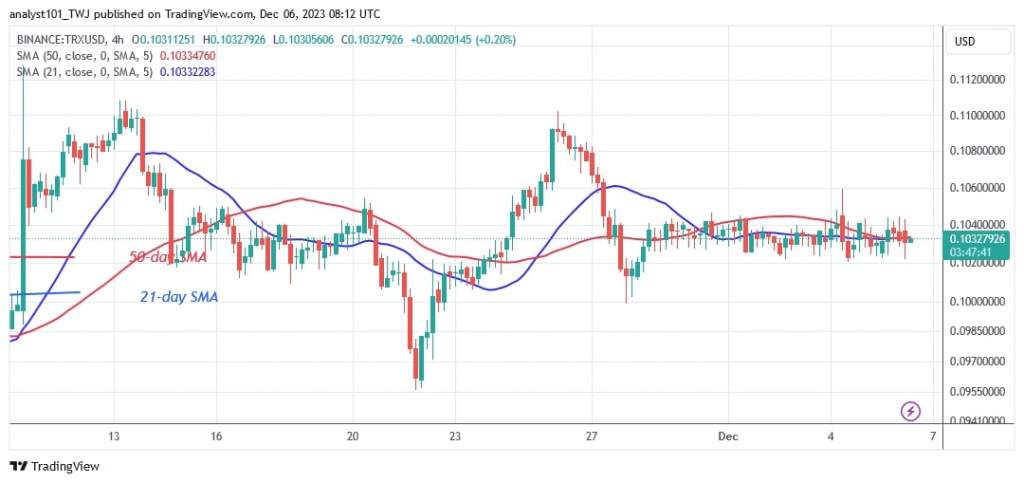
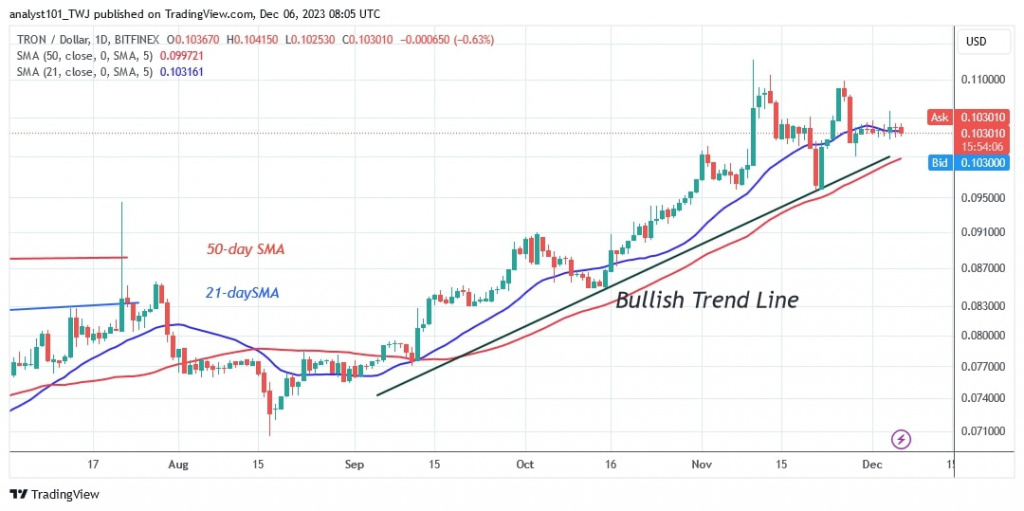
TRON (TRX) has been above the $0.10 support and between the moving average lines since November 27. Doji candlesticks have dominated the market movement after the November 27 price drop. The altcoin is consolidating above the $0.10 support due to the tiny candlestick bodies.
Moreover, the price action has been restricted above the existing support. TRX/USD is trading at $0.103 at the time of writing.
TRON indicator reading
The price bars on the daily chart are neither below nor above the moving average lines. The moving average lines, on the other hand, remain in an uptrend, reflecting the previous rise. On the lower time frame, TRON has resumed a horizontal trend, with the moving average lines remaining parallel.
Technical indicators
Key supply zones: $0.07, $0.08, $0.09
Key demand zones: $0.06, $0.05, $0.04
What is the next direction for TRON?
TRX/USD is currently in a sideways trend, trading in a narrow range between $0.102 and $0.104. The altcoin is trading above the support level of $0.102, but below the high of $0.104. The cryptocurrency price experts ant Coinidol.com suggest that the altcoin will continue to range for a few more days until the trend resumes.

Disclaimer. This analysis and forecast are the personal opinions of the author and are not a recommendation to buy or sell cryptocurrency and should not be viewed as an endorsement by CoinIdol.com. Readers should do the research before investing in funds.


