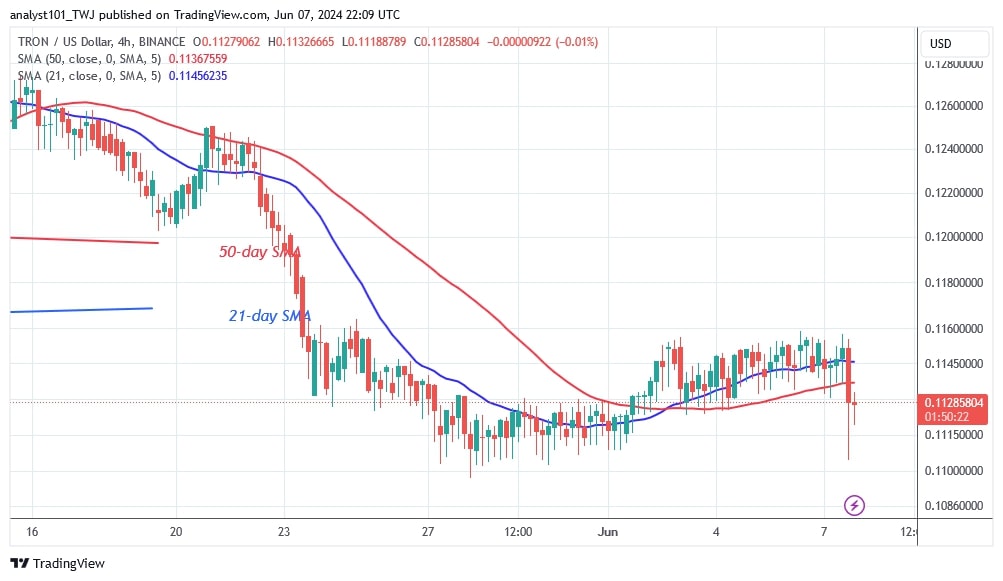
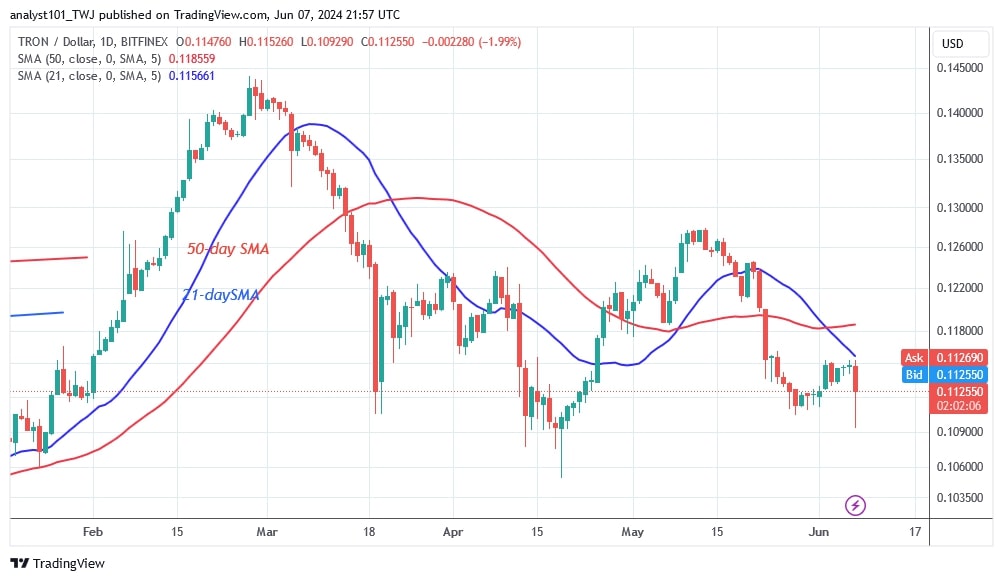
The price of TRON (TRX) has slipped below the moving average lines and has returned to its previous low of $0.109.
Long-term forecast for the TRON price: bearish
The cryptocurrency value has returned to its range, indicating a sideways trend. TRON is currently trading between $0.10 and the resistance of $0.122. On May 8, the bulls broke through the barrier at $0.122, but the upside momentum was halted at the high of $0.126, as reported by Coinidol.com previously. The positive momentum is expected to surpass its previous high of $0.144. Today, the altcoin fell to a low of $0.109 after the 21-day SMA rejected it.
The uptrend will continue if the price rises above the moving average lines. The bulls have defended their current support since March 19. The value of the altcoin currently stands at $0.113.
TRON indicator reading
After rejecting the resistance at $0.127, the price bars have returned below the moving average lines. The 21-day SMA is below the 50-day SMA, indicating a bearish crossover. In the meantime, the negative momentum above the current support has subsided.
Technical indicators
Key supply zones: $0.13, $0.14, $0.15
Key demand zones: $0.10, $0.09, $0.08
What is the next development for TRON?
On the 4-hour chart, TRON is falling below the moving average lines. The altcoin will continue to decline. Today, the altcoin fell sharply and hit a low of $0.1109, but the bulls bought the dips. TRON has corrected upwards and is holding above the support level of $0.112. The altcoin has reached bearish exhaustion and the crypto signal remains range-bound.

Disclaimer. This analysis and forecast are the personal opinions of the author and are not a recommendation to buy or sell cryptocurrency and should not be viewed as an endorsement by CoinIdol.com. Readers should do their research before investing in funds.


