The latest price analysis by Coinidol.com report, the price of TRON (TRX) has slipped below the moving average lines after previously hovering above them.
TRON price long term forecast: bearish
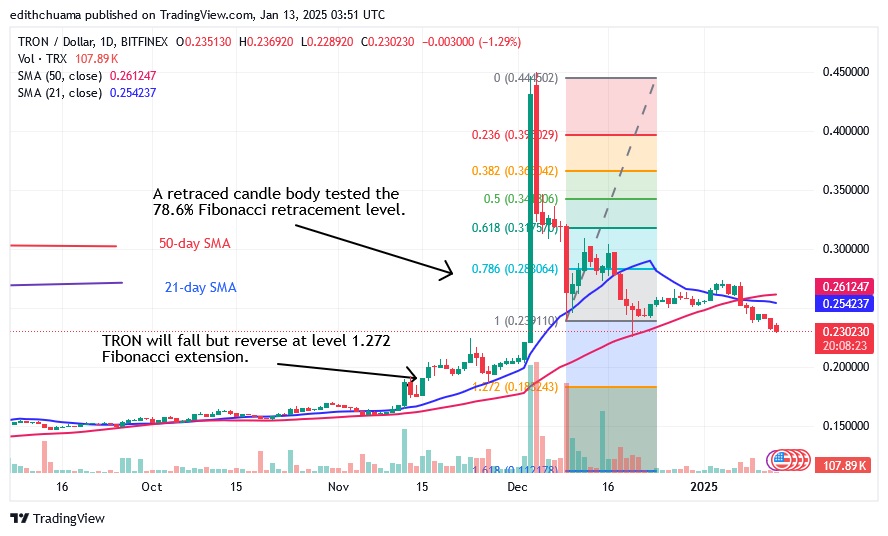
Since January 3, 2025, TRON has stabilized above the moving average lines but below the $0.28 resistance level. Upside moves were thwarted by the resistance at $0.28, leading to a decline. The price indication for TRON has shown a further decline. During the price decline on December 9, a candlestick body retested the 78.6% Fibonacci retracement line. The upward correction predicts that TRON will fall but reverse at the Fibonacci extension of $1.272 or $0.183. Today, the altcoin is in the red, trading at $0.2276 at the time of writing.
TRON indicator analysis
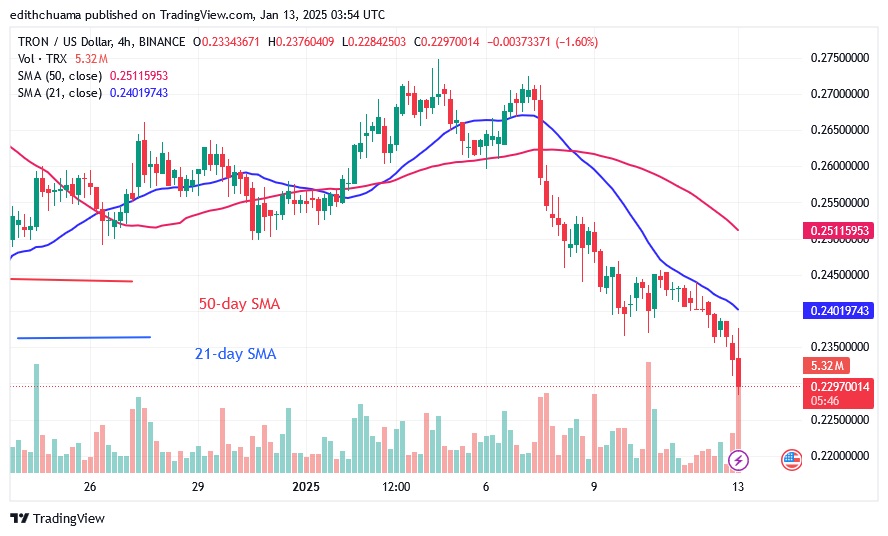
On both charts, the price bars are below the moving average lines. The 21-day SMA is below the 50-day SMA, which is a bearish sign. The price action is also characterised by doji candlesticks, which show a slower price movement. On the 4-hour chart, the 21-day SMA serves as a resistance line for the price bars.

Technical indicators
Key resistance zones: $0.40, $0.45, and $0.50
Key support zones: $0.20, $0.15, and $0.10
What is the next move for TRON?
On the 4-hour chart, TRON has fallen below the moving average lines. The altcoin has dropped to a low of $0.2256. It is likely that the cryptocurrency will continue to fall and reach a low of $0.1836. The bearish momentum has surpassed the price level of December 20, 2024 and reached a low of $0.2237. On the 4-hour chart, TRON is falling below the moving average lines. The altcoin has fallen to a low of $0.2256. The cryptocurrency is likely to fall further and reach a low of $0.1836.

Disclaimer. This analysis and forecast are the personal opinions of the author, are not a recommendation to buy or sell cryptocurrency, and should not be viewed as an endorsement by CoinIdol.com. Readers should do their research before investing in funds.


