- Bitcoin price shows a classic Power of Three (PO3) setup in play, forecasting a potential decline to $25,296.
- Ethereum price could attempt a rally to $2,028 if the bullish outlook persists.
- Ripple price has set up an inverse head-and-shoulders setup, forecasting a 10.76% increase to $0.515.
Bitcoin (BTC) price has surprised investors with a quick uptick over the weekend, but it is unclear if this is a spurt in buying pressure or a reentry of sidelined buyers. Judging by the price action, the cause of the uptick is unclear and the bearish outlook explained in previous articles is still valid.
Also read: Top 3 Price Prediction Bitcoin, Ethereum, Ripple: BTC set to punish greedy bulls
Bitcoin price ready to collapse
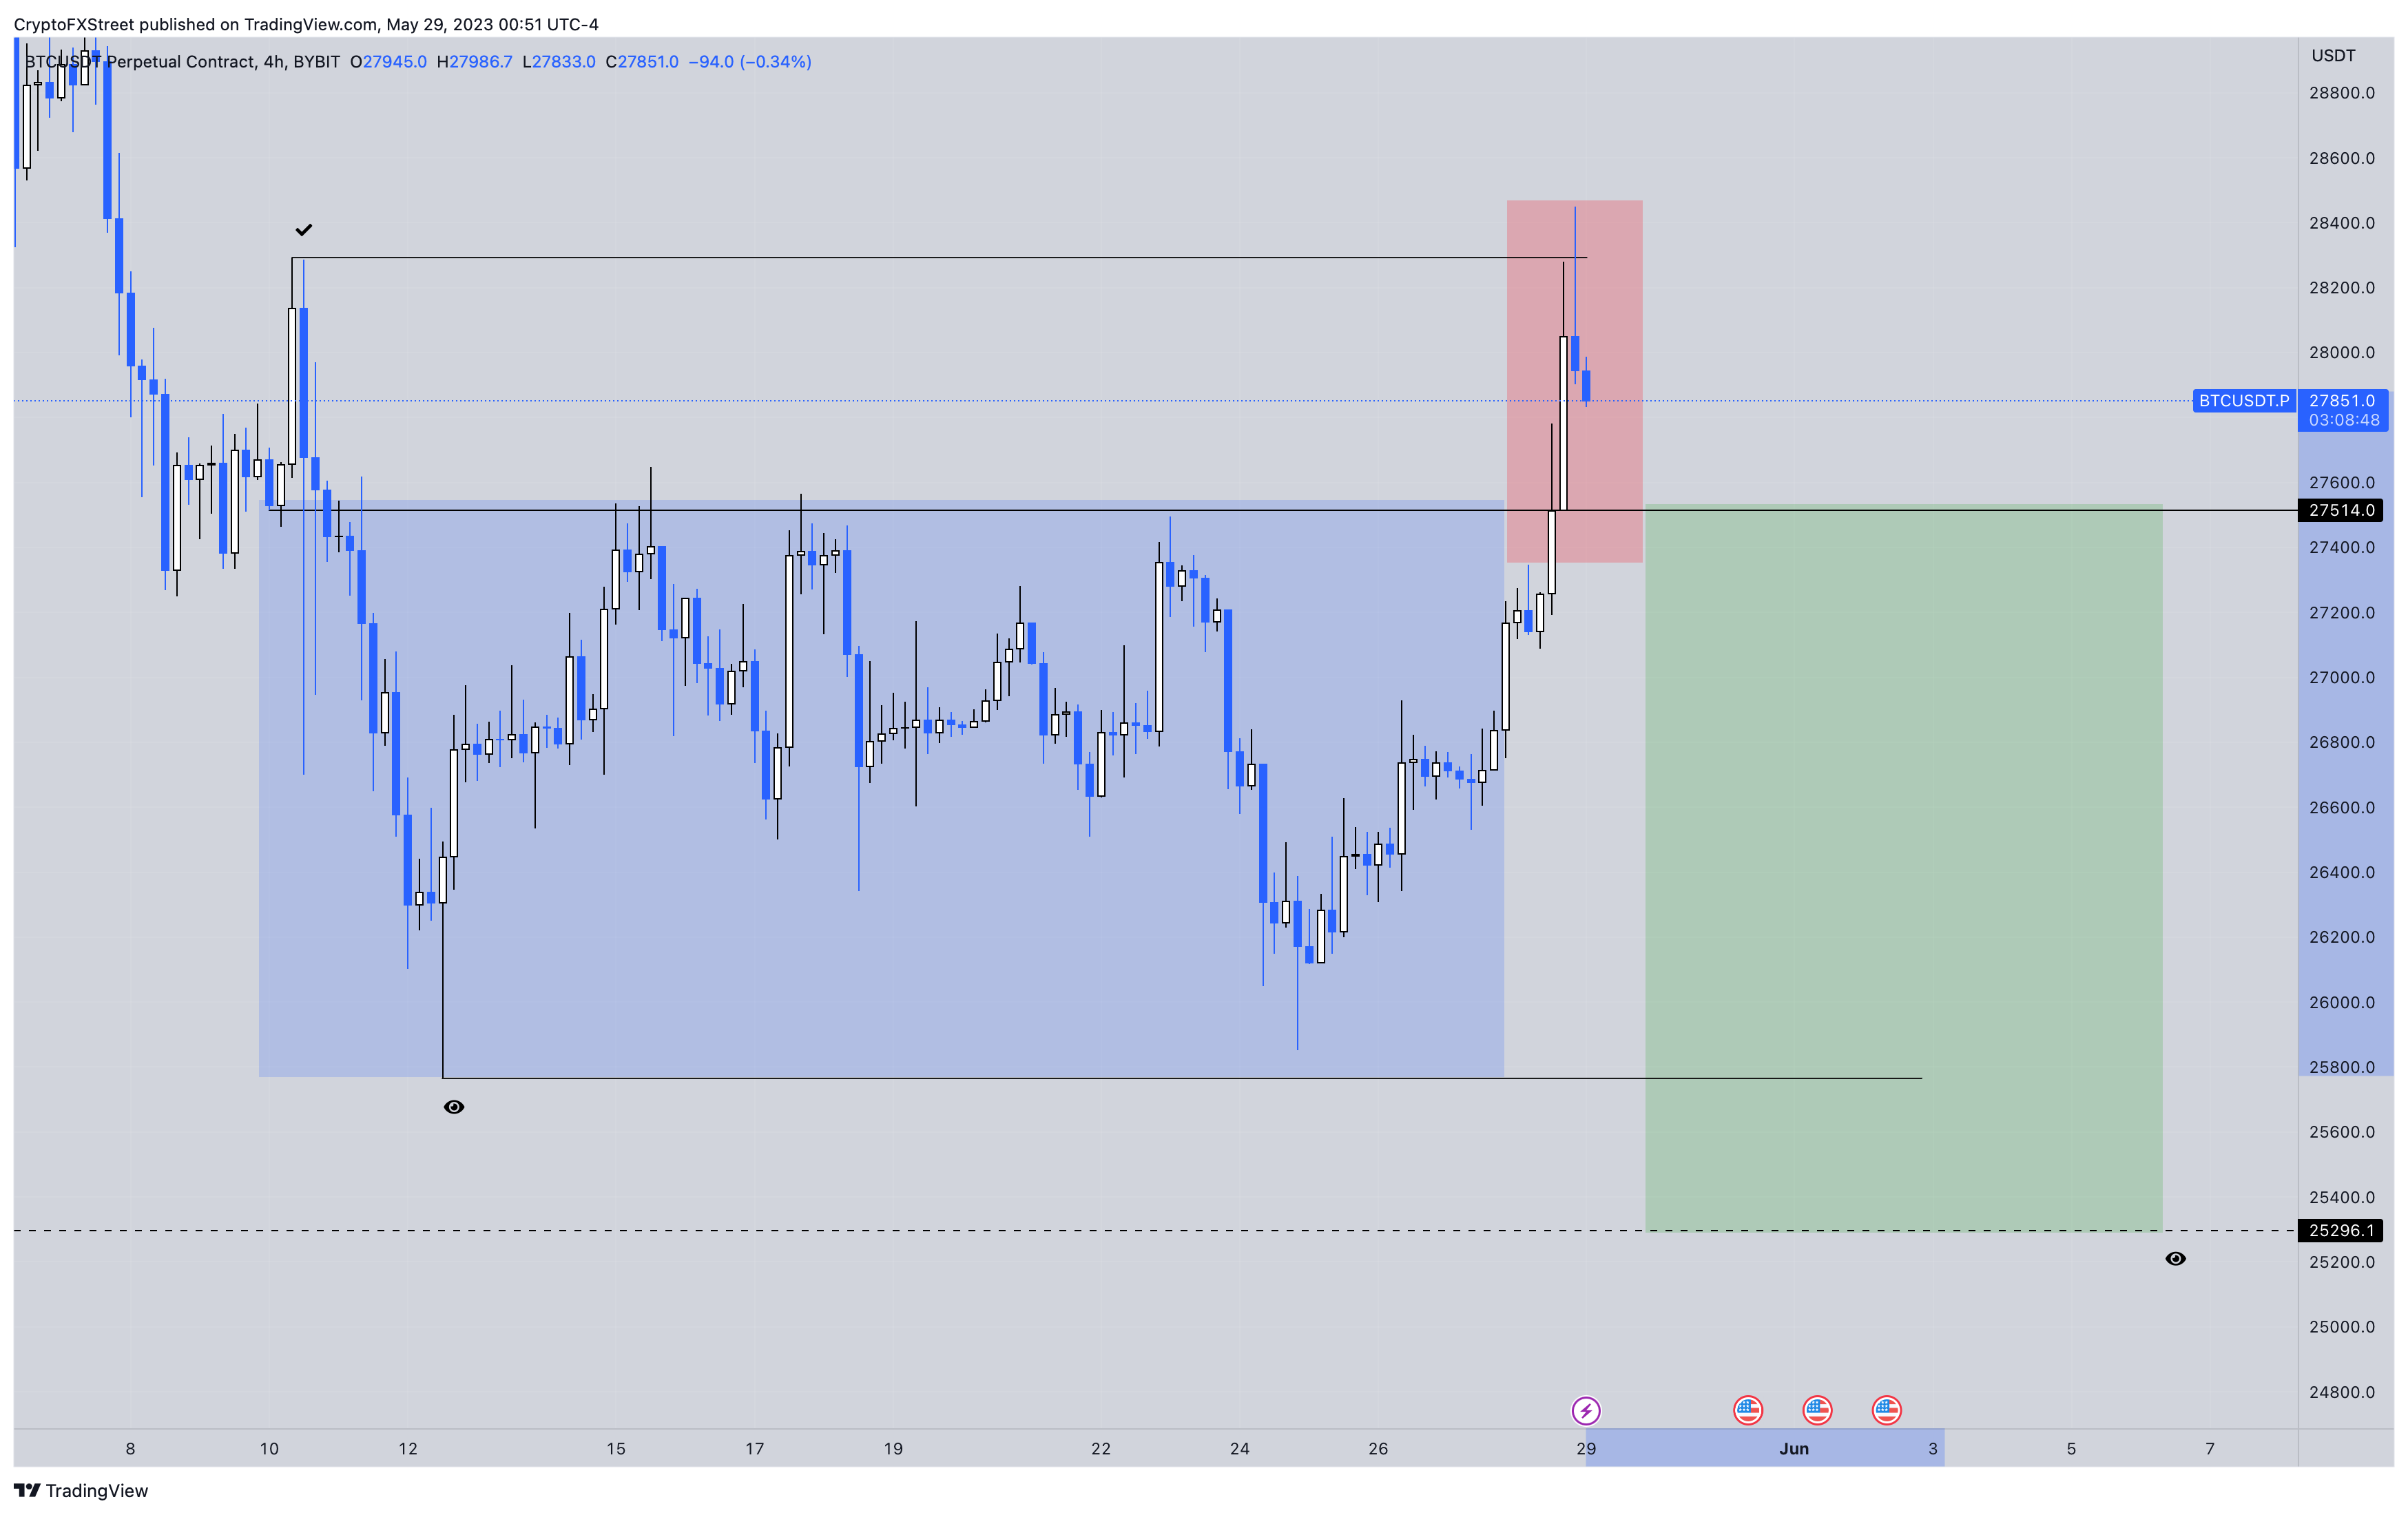
Bitcoin (BTC) price breached its two-week consolidation on May 28 and collected the buy-stop liquidity resting above May 10 swing high at $28,293. This liquidity run was soon followed by a retracement, which is underway and signals a Power of Three (PO3) setup in play.
This technical formation has three phases – accumulation, manipulation and distribution. As the name indicates, the asset usually moves sideways in the first phase and is often followed by a sweep of a critical level, which is termed manipulation.
The third or the last phase is distribution, which leads to volatile rallies in the opposite direction of manipulation. In Bitcoin’s case, BTC swept a local top at $28,293 and is trading at $27,879, signaling the next move should favor bears.
If this setup plays out, Bitcoin price could reach the $25,764 support level to collect the sell-stop liquidity. Should the selling pressure persist even after this 7.6% decline, BTC price could hit the next critical support level at $25,296.
These levels are key accumulation levels, as seen in previous articles.
Read more: Bitcoin Weekly Forecast: BTC delays inevitable crash to $25,000
BTC/USD 4-hour chart
On the other hand, if Bitcoin price continues to tread above the $28,051 level, it could attempt an extension of this weekend’s rally. If the move leads to a flip of the $30,000 psychological level, it would invalidate the bearish thesis.
In such a case, BTC could attempt a retest of the $32,450 hurdle.
Ethereum price needs to stay above this level
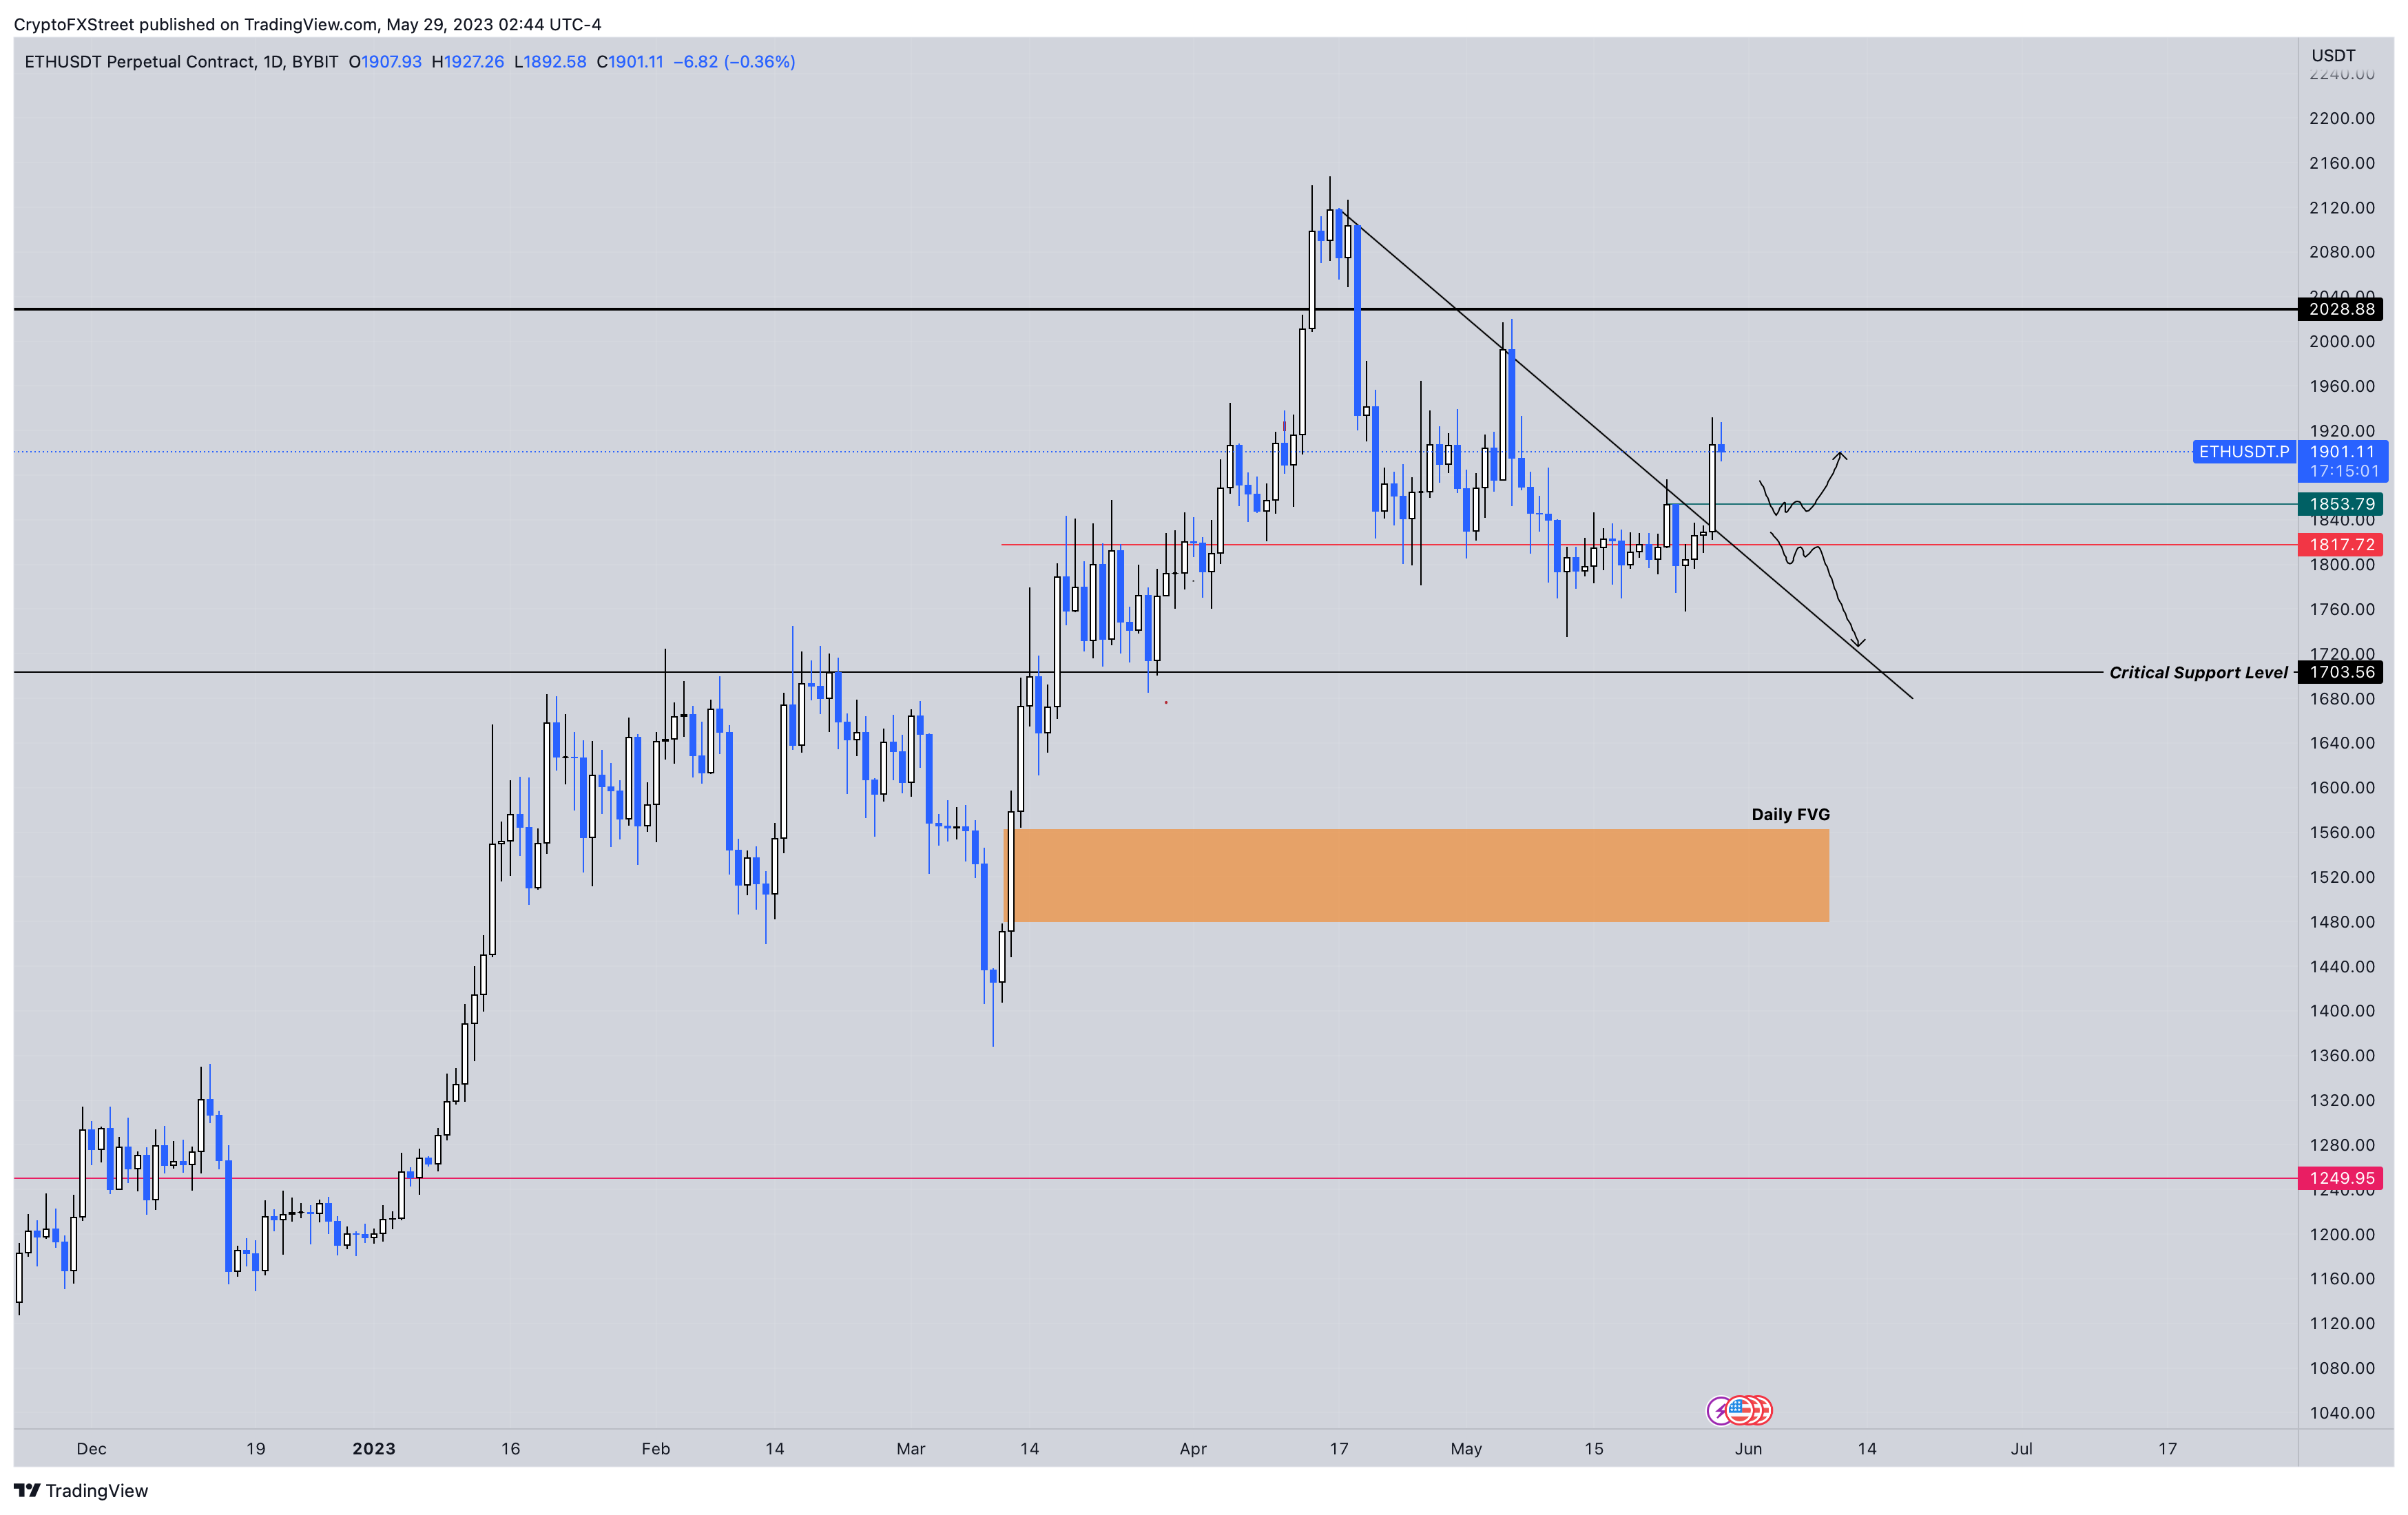
Ethereum price has overcome the $1,817 hurdle and shot up 7% over the weekend. ETH trades at $1,898 at the time of writing but it needs to hold above the $1,853 support level to resume its uptrend.
If successful, ETH could eye a retest of the $2,028 hurdle followed by a sweep of the April 16 high at $2,147.
ETH/USD 1-day chart
On the contrary, if Ethereum price breaches the $1,853 support level, investors should pay attention to $1,817. If this level fails to hold, ETH will invalidate the bullish thesis and could trigger a correction to $1,703.
Ripple price flips bullish amid confusing times
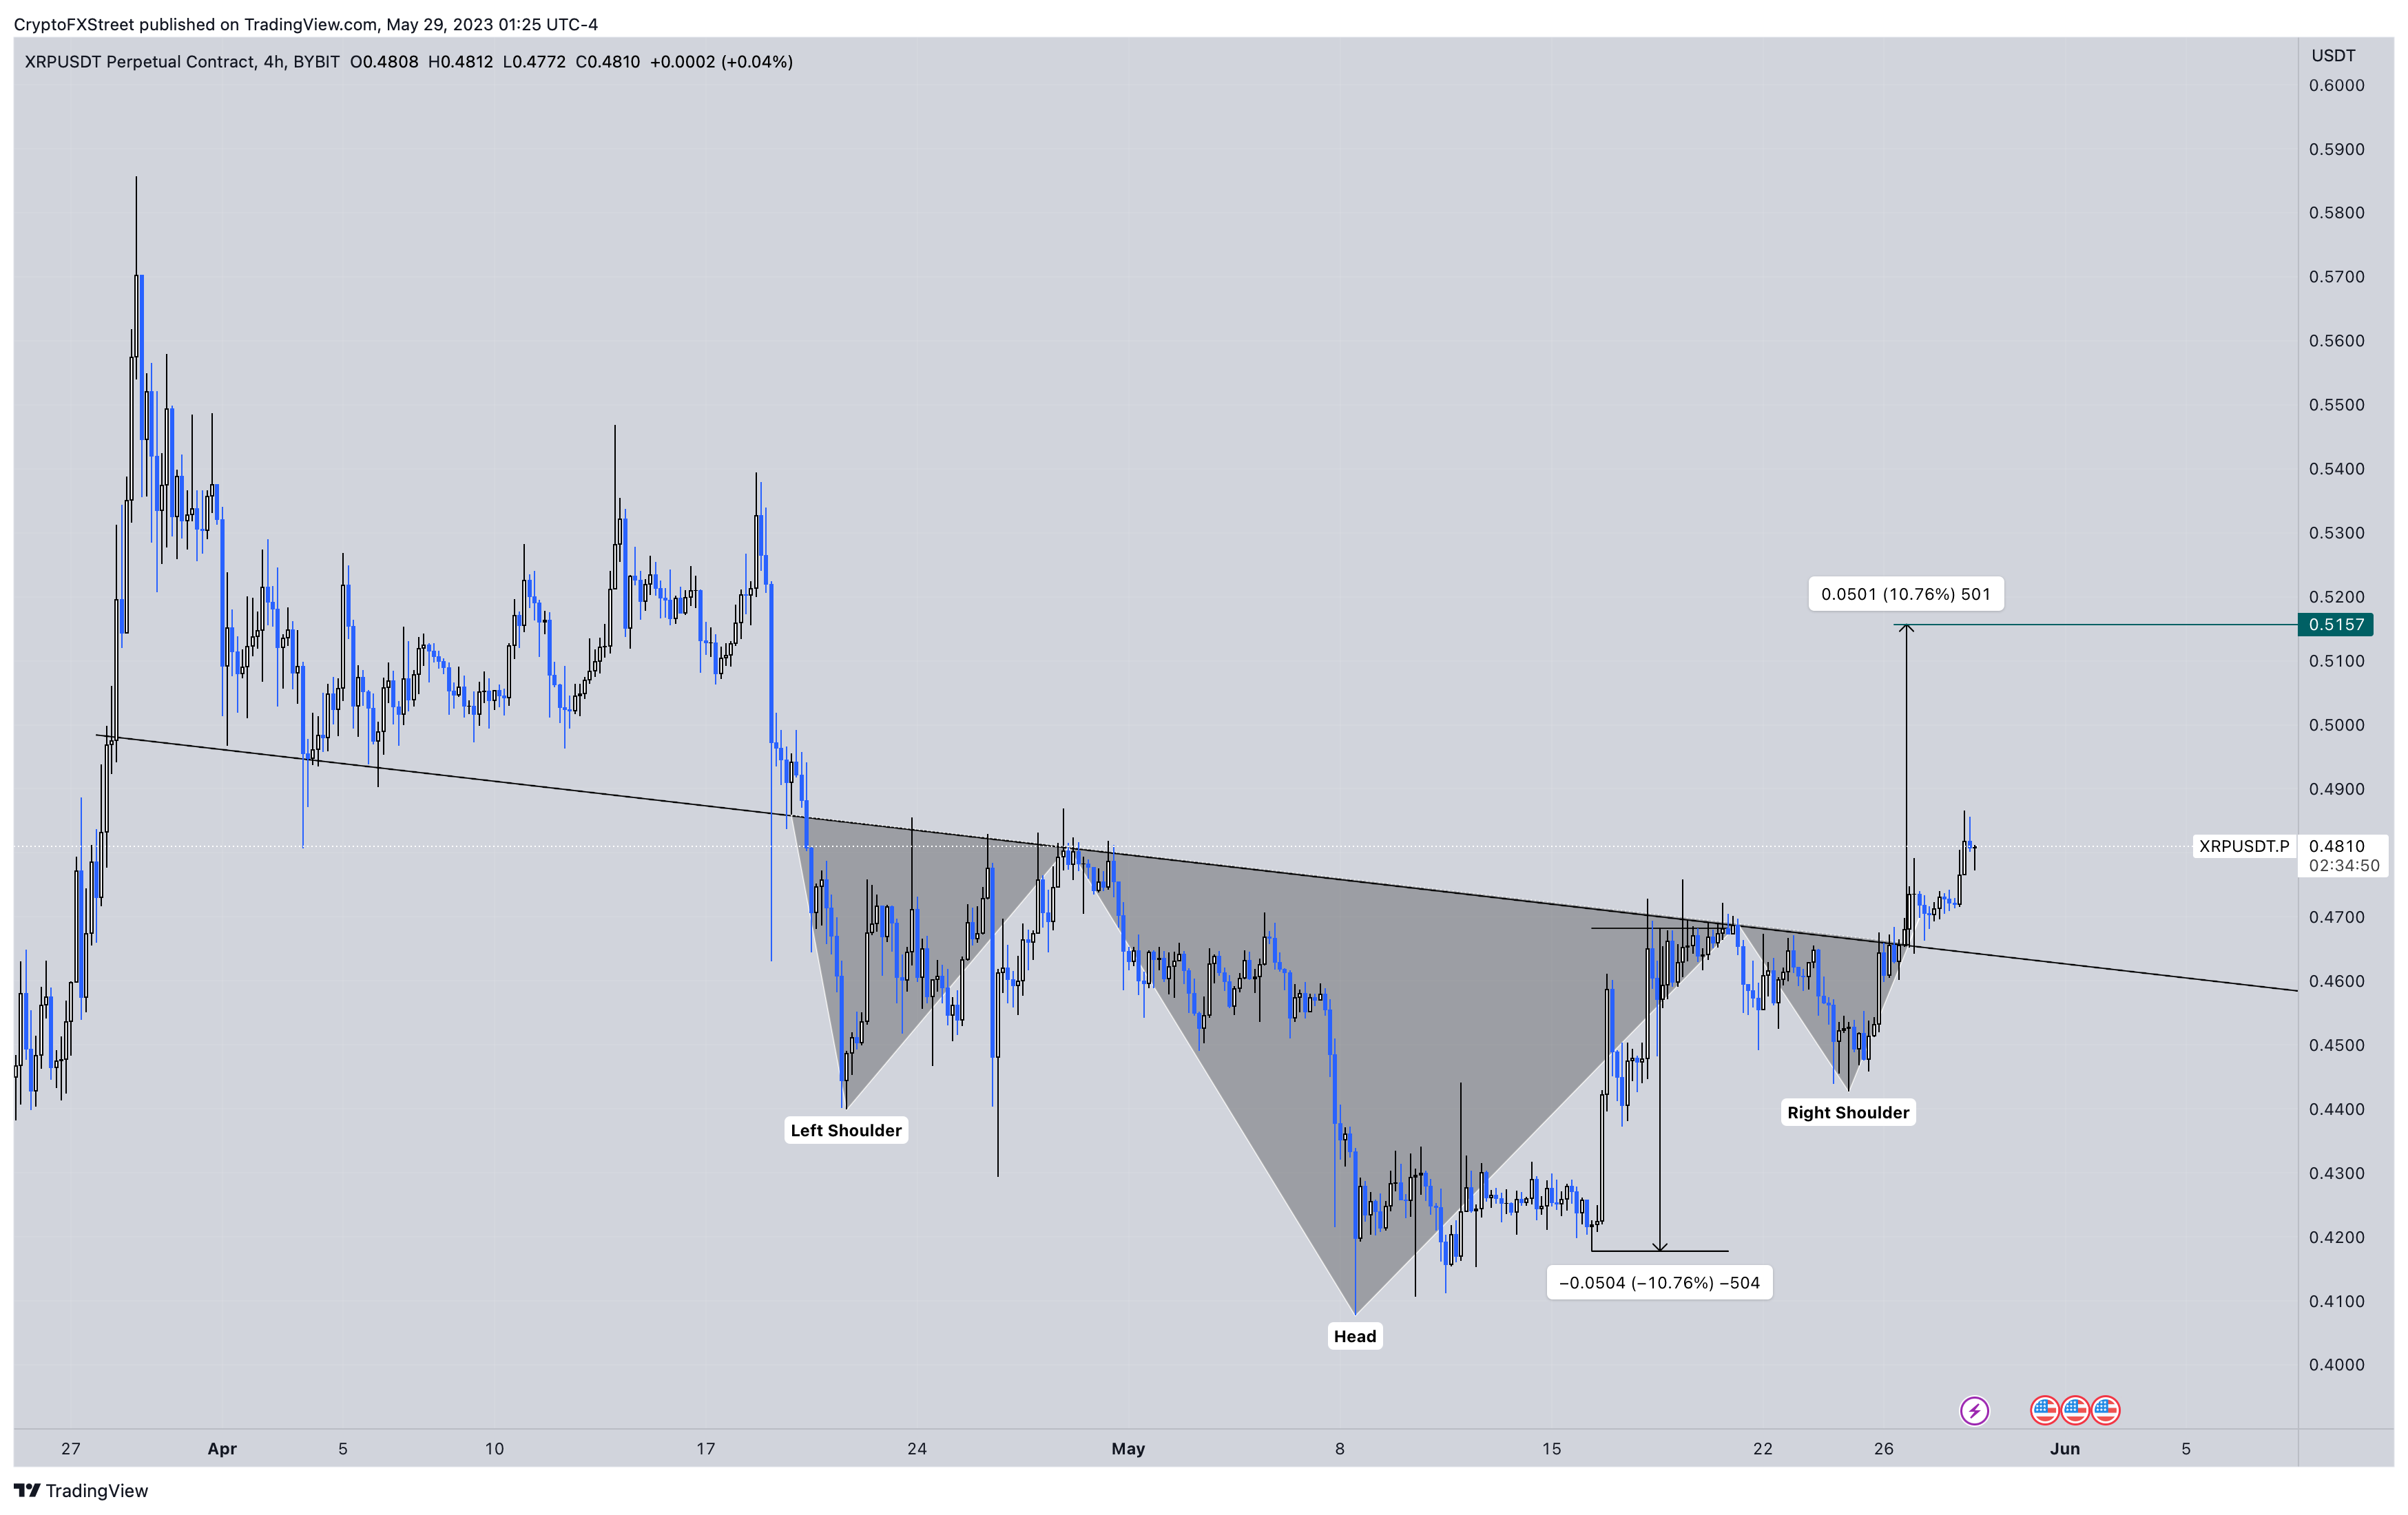
Ripple price has set up an inverse head-and-shoulders set up on the four-hour chart. This technical formation contains three swing lows, with the central one lower than the other two. The ones on each side are defined as the shoulders, while the central one is the head. Connecting the peaks using a trend line reveals a declining resistance level known as the neckline.
This setup forecasts a 10.76% upswing to $0.515, determined by measuring the distance between the right shoulder’s peak and the head’s lowest point, adding it to the breakout point at $0.465 (see chart below).
So far, Ripple price has not only breached the neckline but has also rallied nearly 4%, currently trading at $0.481. If the bullish trend continues, XRP price could rally another 7.30% before it hits the theoretical target.
XRP/USD 4-hour chart
Invalidation of the inverse head-and-shoulders setup will occur if Ripple price slices the neckline at $0.465. If this bearish outlook continues, XRP price could slide towards the May 24 low at $0.442.


