- Bitcoin price shows some life as the new week kickstarts, suggesting a potential short-term move to the upside.
- Ethereum price will follow Bitcoin’s footsteps and is likely to revisit the $1,703 and subsequent support levels.
- Ripple price looks like a rebel but investors should exercise caution considering the uncertain outlook of the market.
Bitcoin price is at a stage where if history repeats, it could catch investors off guard. Bulls are likely being set up for a trap, which will cause massive liquidations for holders of Ethereum (ETH), Ripple (XRP) and other altcoins.
Also read: Ordinals sends LTC and DOGE network activity surging for three straight weeks
Bitcoin price action could turn into a fractal
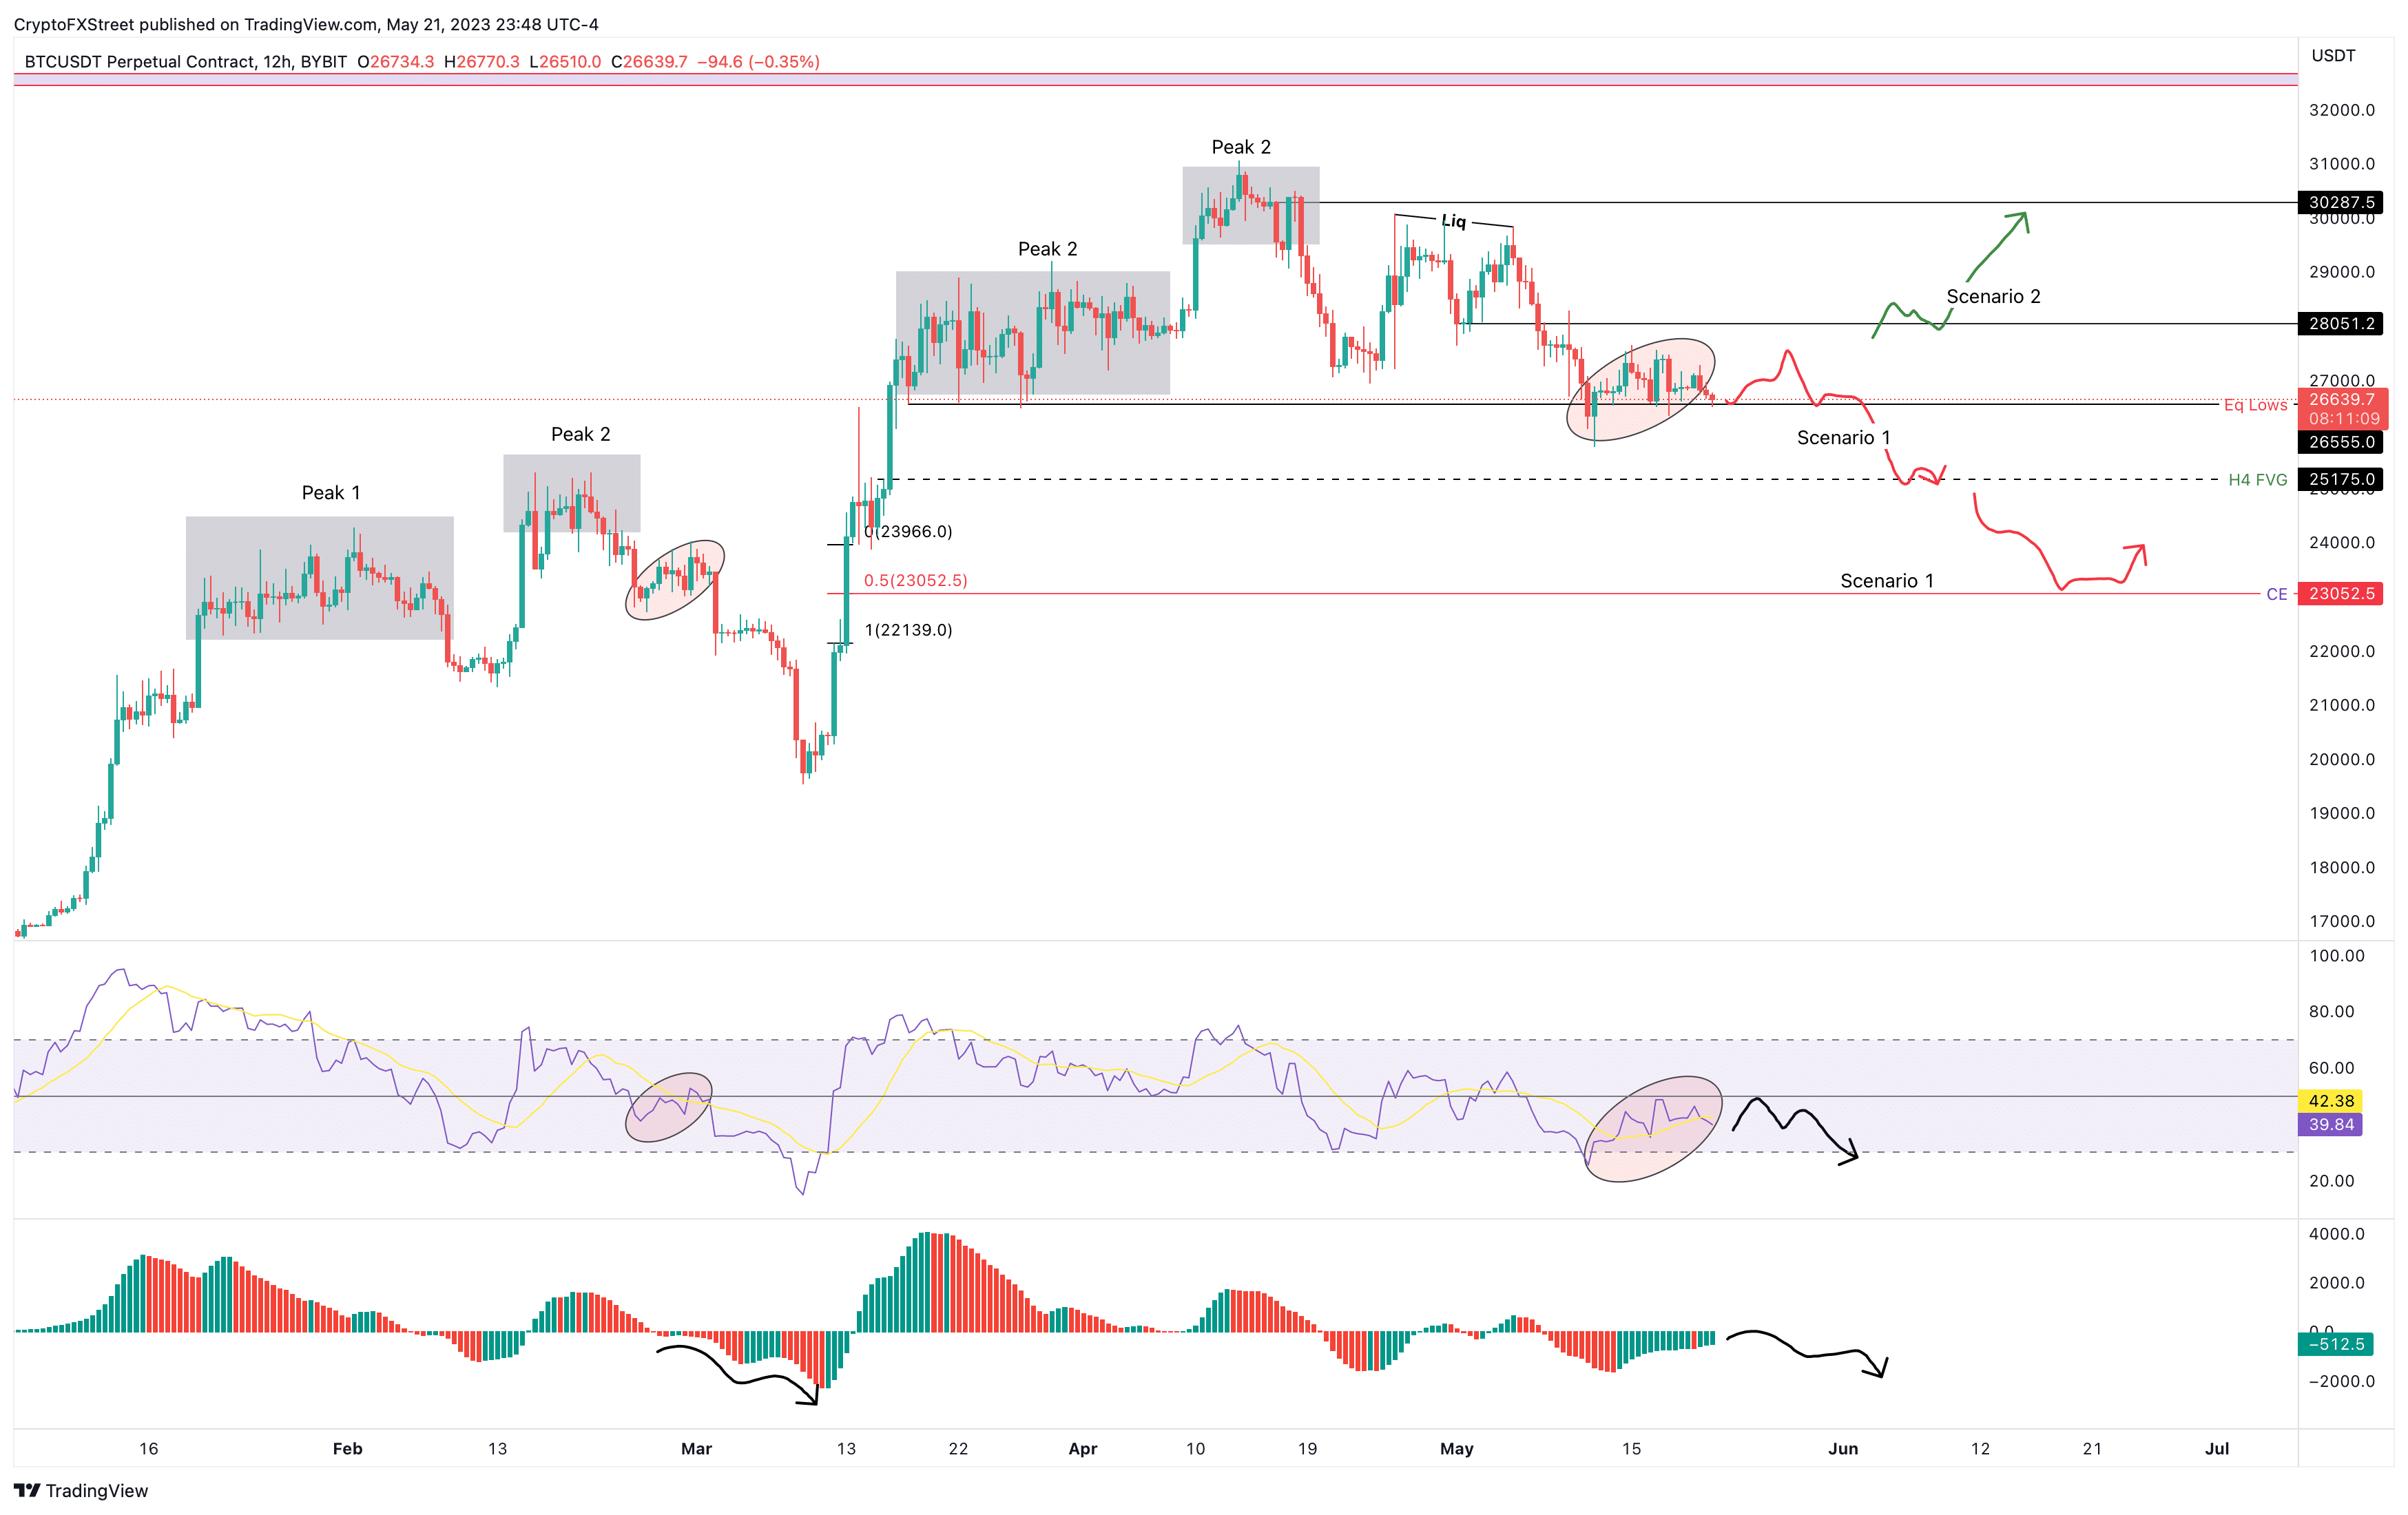
Bitcoin price action over the last two months is reminiscent of the moves that occurred between January 20 and March 1. The repeating pattern is termed fractal and can be seen even in the Relative Strength Index (RSI) and Awesome Oscillator (AO) momentum indicators.
If history does repeat, then investors can first expect Bitcoin price to trigger a minor recovery rally to $28,051. This move is ‘scenario one’ and will push BTC to collect the buy-stop liquidity before, as seen in the chart below. After this liquidity run, sellers are likely to take control and catalyze a steep correction, trapping early and greedy bulls on the wrong side.
The RSI and AO indicators are perfectly positioned below their respective mean levels for a rejection followed by a pullback. The second leg of scenario one includes Bitcoin price sliding down to tag the support levels at $25,175 and $23,062.
BTC/USD 12-hour chart
The bullish thesis, or scenario 2 for Bitcoin price, will include BTC invalidating the fractal outlook and flipping the $28,051 hurdle into a support floor. Doing so will pave the way for BTC to tag $30,287.
Ethereum price fails to take control
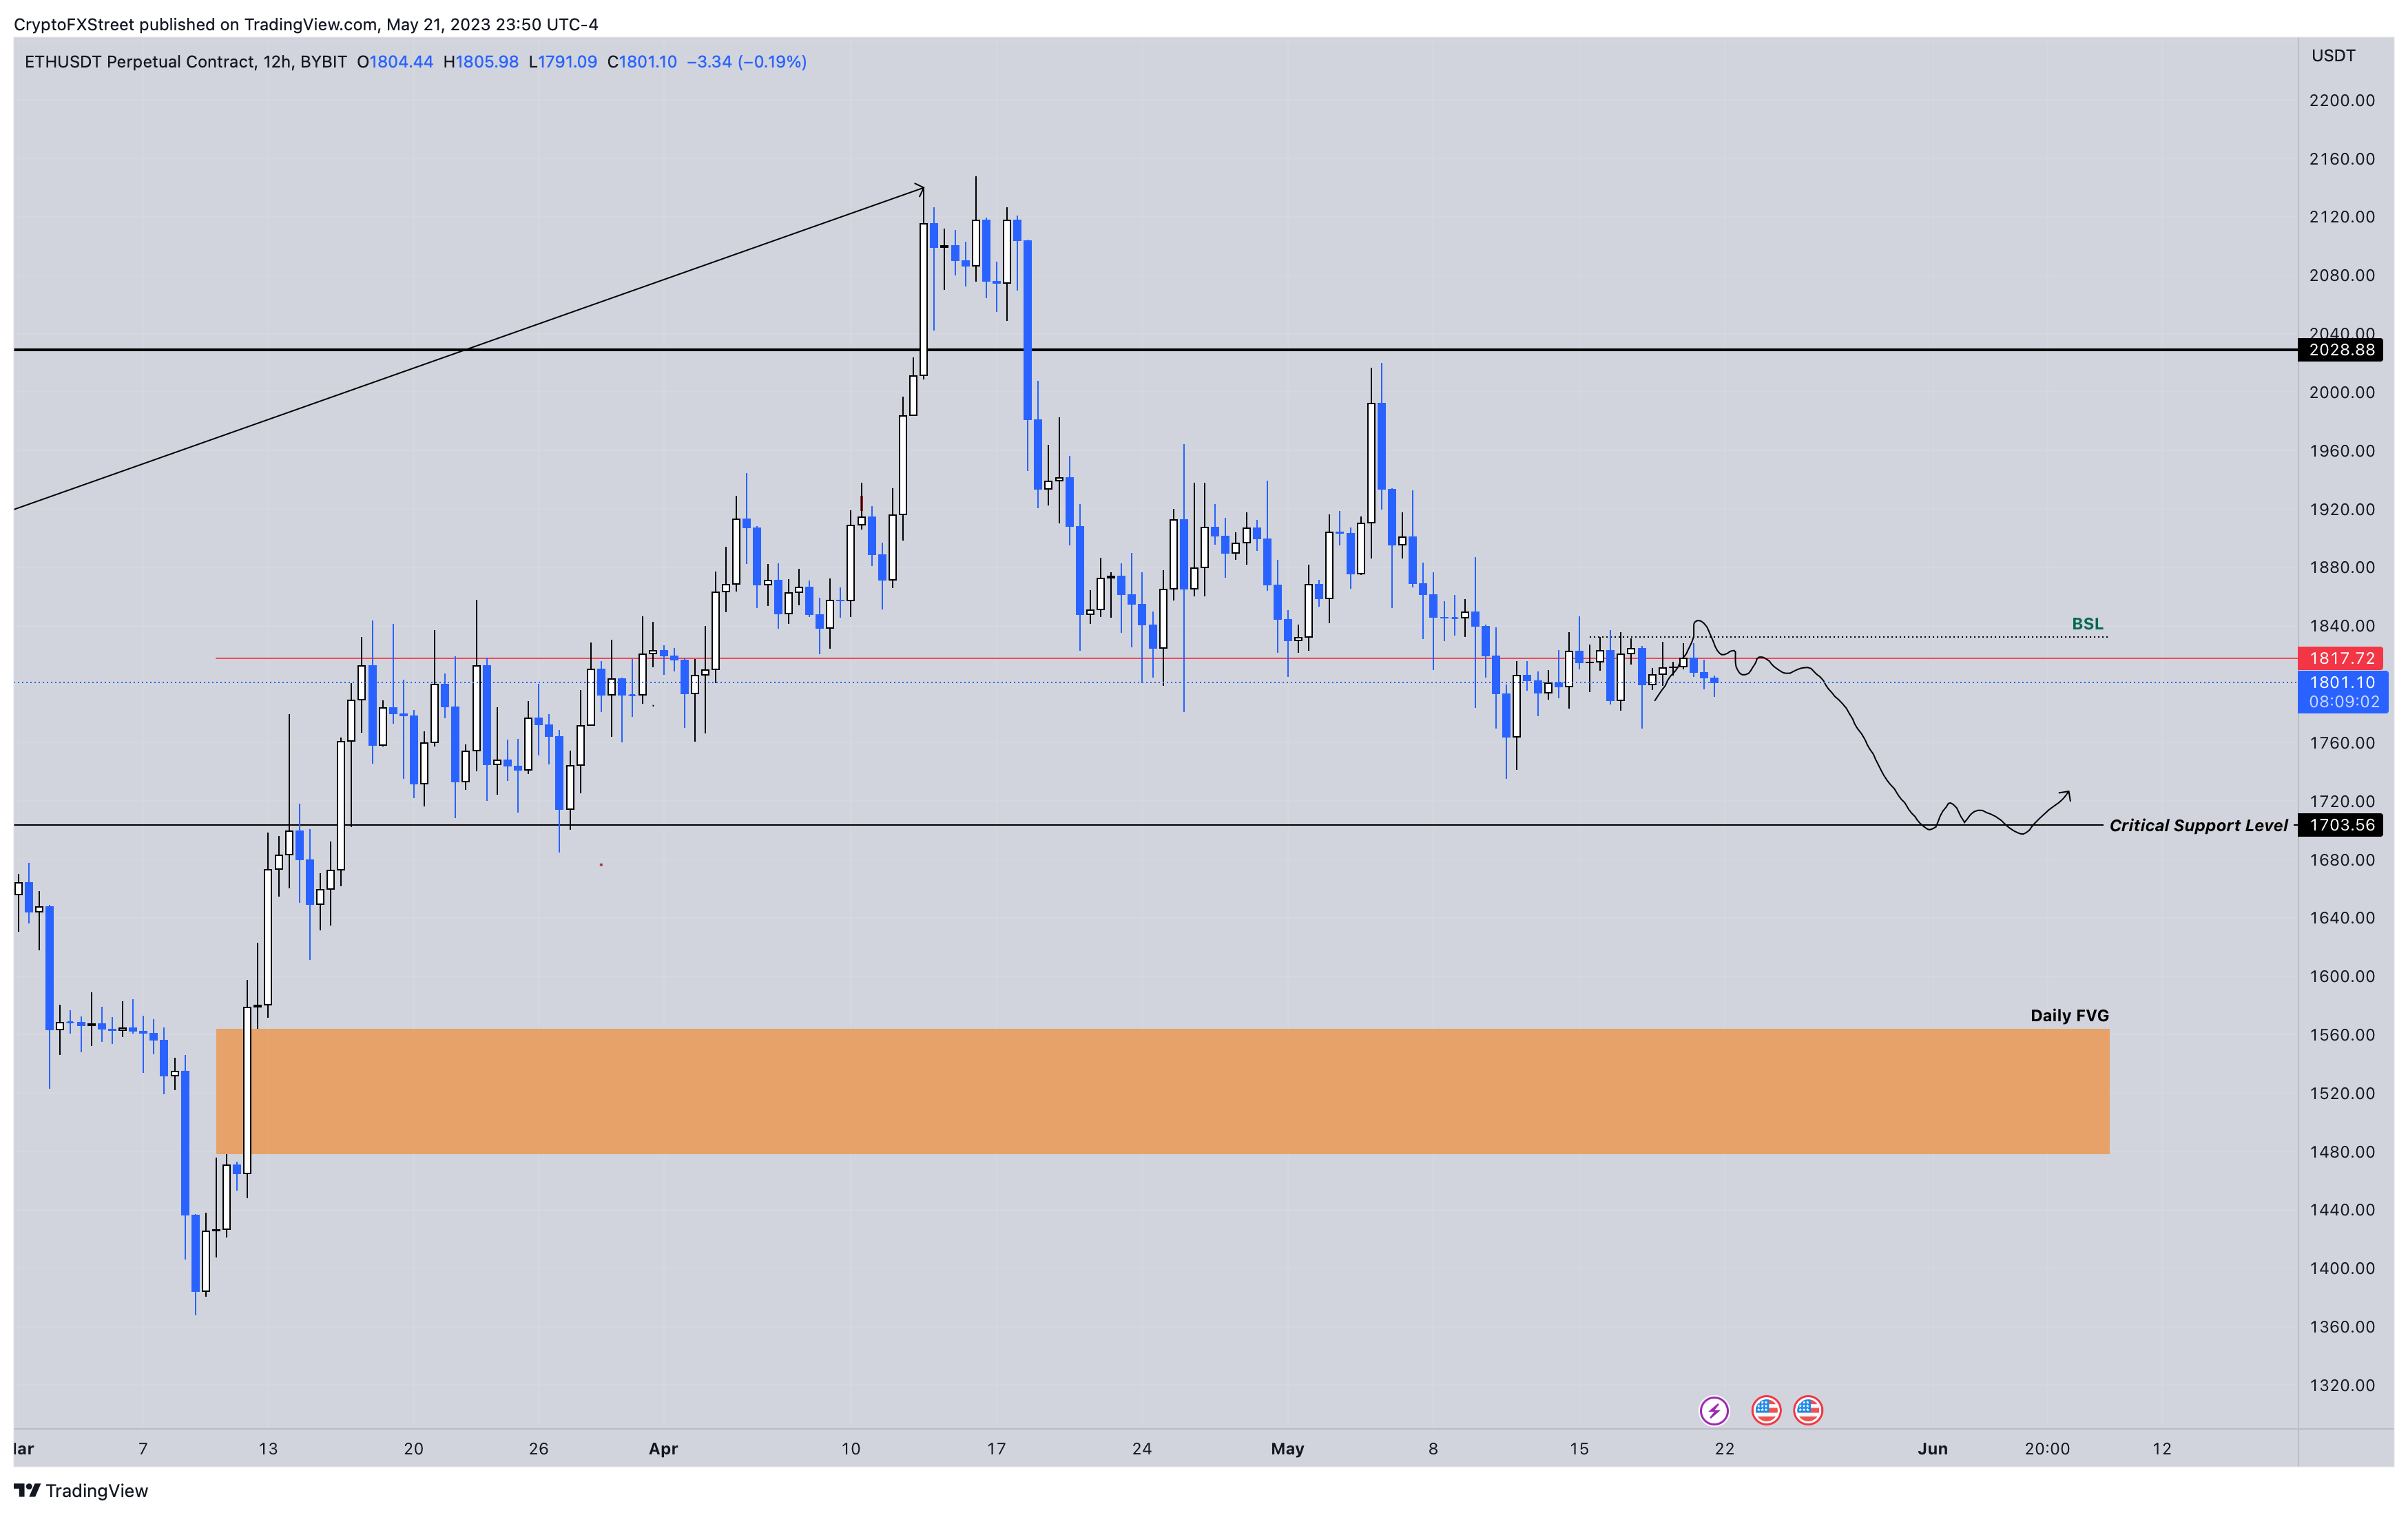
Ethereum price has been struggling to move above a critical hurdle at $1,817 for nearly ten days now. Starting this week, investors can expect a minor rally that sweeps the aforementioned level to collect buy-stop liquidity.
This move is likely to trigger a buying spree from greedy bulls, who are likely to get trapped if Ethereum price suddenly reverses. A subsequent spike in selling pressure could push ETH down to the $1,703 support level. This move would constitute a 6.4% descent.
But if the selling pressure continues to build, Ethereum price could shatter the $1,703 barrier and visit the support zone, extending from $1,563 to $1,478.
ETH/USD 12-hour chart
Invalidation of the bearish outlook for Ethereum price will require a bullish ascent in Bitcoin price in which ETH could flip the $1,817 hurdle into a support floor. In such a case, ETH could attempt to tag the $2,028 resistance level.
Ripple price pushes higher for now
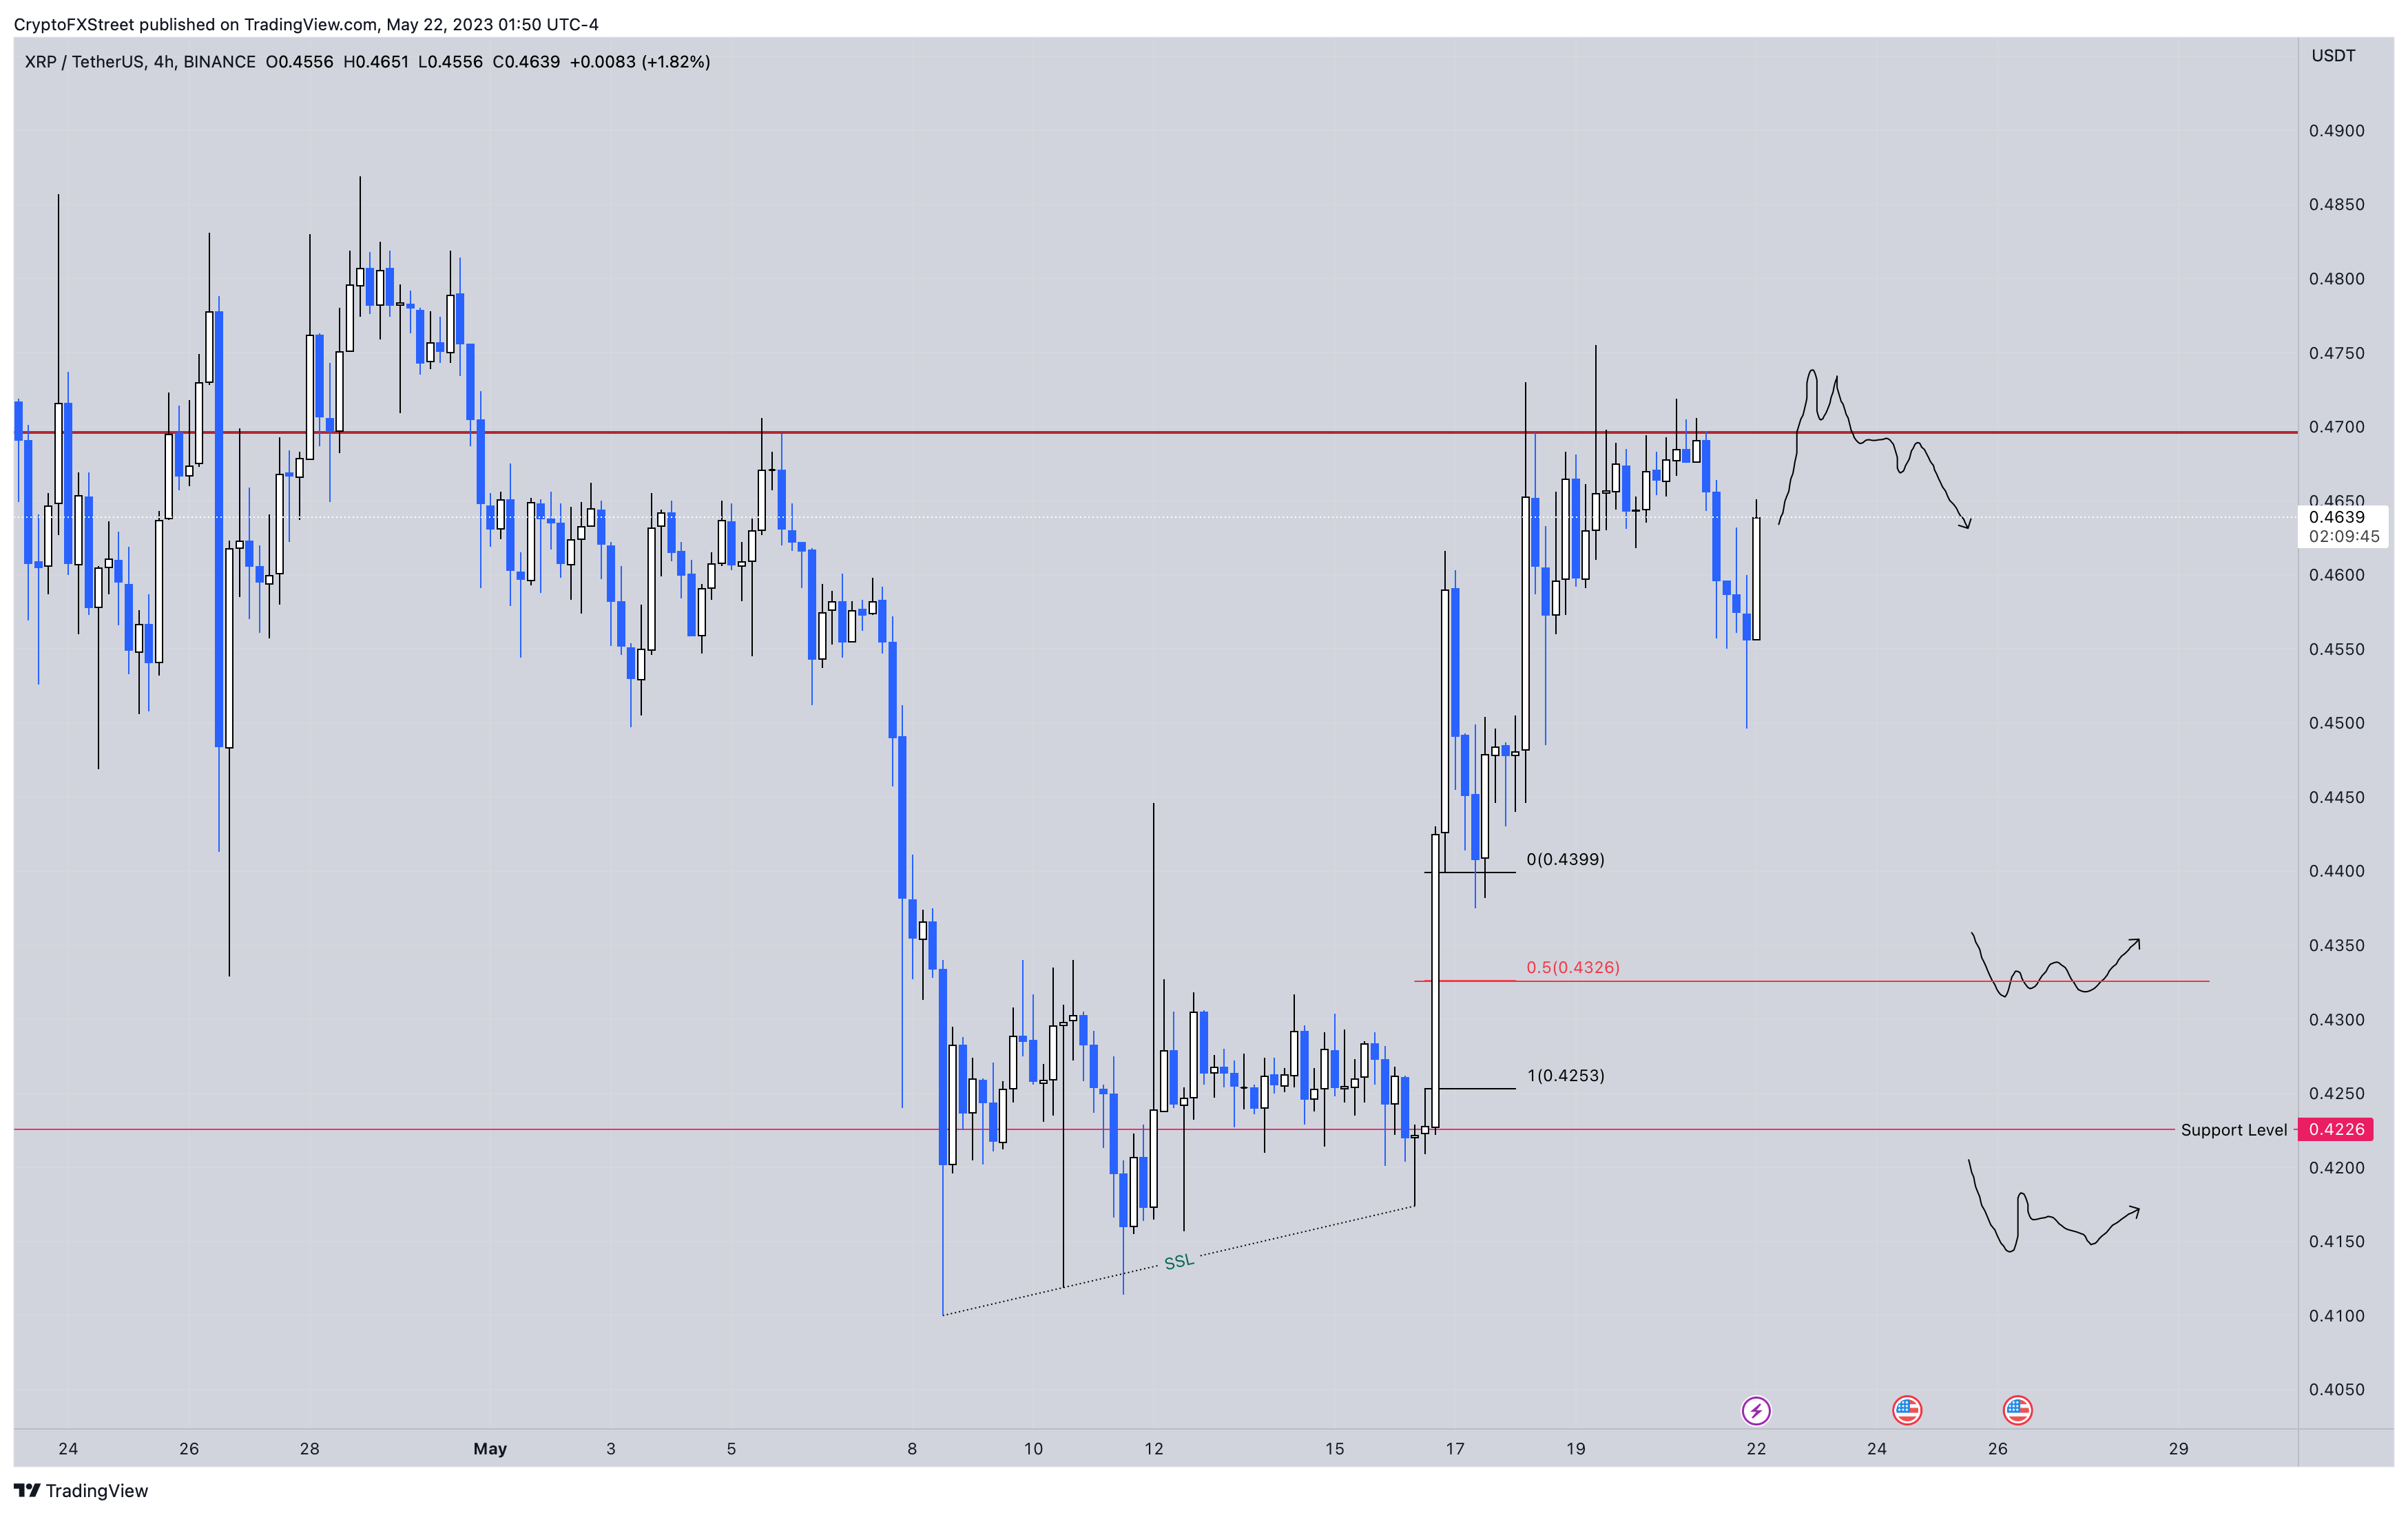
Ripple price faced rejection at $0.469 after multiple attempts in May. The failure to overcome this blockade has knocked XRP price lower, where it currently trades at $0.463. Going forward, investors can expect the remittance token to sweep the $0.469 hurdle for buy-stop liquidity, but if Bitcoin price collapses midway, the altcoin might also follow suit.
In such a case, market participants need to focus on Ripple price revisiting the $0.439 and $0.432 levels, which are critical to stopping the downswing. From the current position, this move would constitute a 6.4% descent.
XRP/USD 4-hour chart
While the outlook for Ripple price is bearish due to the uncertainty of Bitcoin price, investors need to note that a decisive flip of the $0.469 hurdle will invalidate the bearish thesis. In such a case, XRP price might attempt a retest of the $0.500 psychological level.


