The price of Toncoin (TON) has continued its sideways trend as it falls between moving average lines. Price analysis by Coinidol.com.
Long-term forecast for Toncoin price: bullish
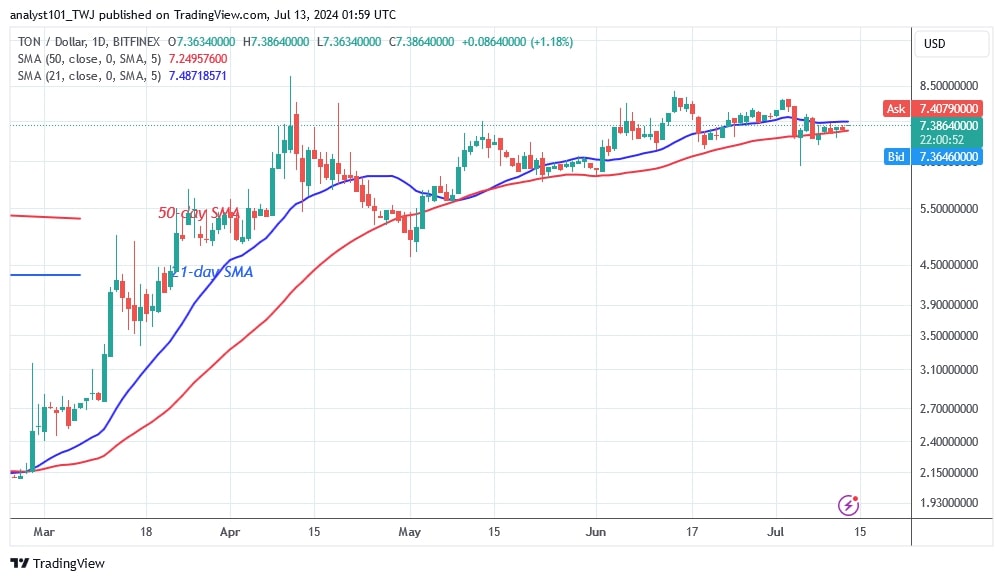
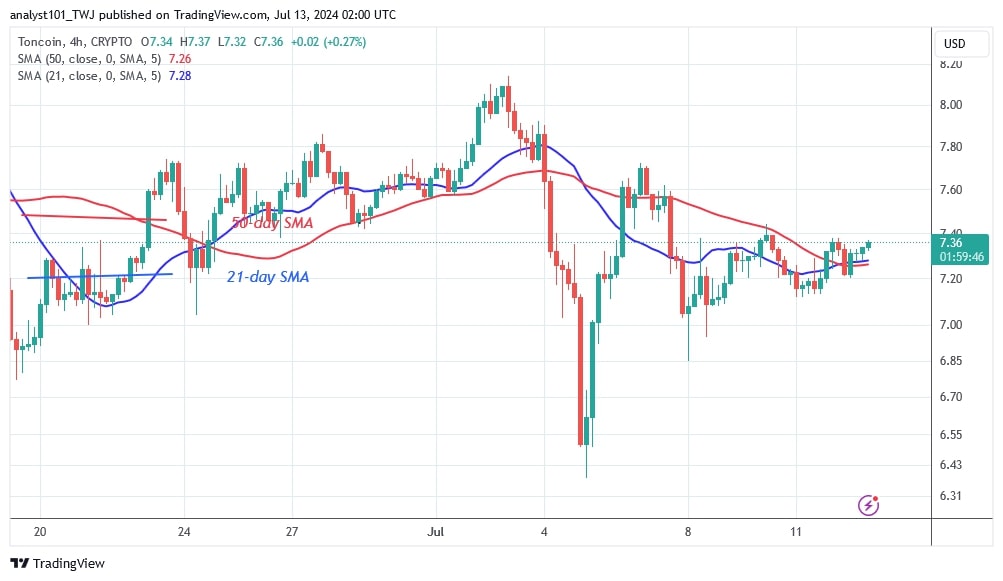
The previous uptrend ended when it hit resistance at $8.00. The current trend is trapped between the moving average lines. The upward and downward movement of the price has been restricted by the limit of the price.
If the altcoin recovers to the upside, the 21-day SMA will be breached and the bullish momentum will extend to the $8.00 high. A break above the $8.00 level would signal the resumption of the uptrend. Conversely, a break below the 50-day SMA will send the altcoin back to the previous low of $4.80.
Analysis of the Toncoin indicators
Since July 4, the cryptocurrency’s price bars have been trapped between the moving average lines. This will restrict the price to the moving average lines. The price movements of TON will be limited to a certain range. The appearance of doji candlesticks has resulted in negligible price movement.
Technical indicators
Resistance levels: $6.00, $8.00, $10.00
Support levels: $5.00, $3.00, $1.00
What’s next for Toncoin?
On the 4-hour chart, TON has maintained a sideways trend within a limited price range of $7.00 to $7.40. Doji candlesticks have dominated the price activity. Currently, the uptrend is being held back by resistance at $7.40. The price of the cryptocurrency will rise or fall as long as it is trapped in a small range.
Coinidol.com reported on July 5 that TON was in a bull market and has remained on its uptrend since breaking above the $2.80 resistance level.
Disclaimer. This analysis and forecast are the personal opinions of the author and are not a recommendation to buy or sell cryptocurrency and should not be viewed as an endorsement by CoinIdol.com. Readers should do their research before investing in funds.


