The price of Toncoin (TON) fell below the moving average lines before recovering.
Long-term forecast for the Toncoin price: bearish
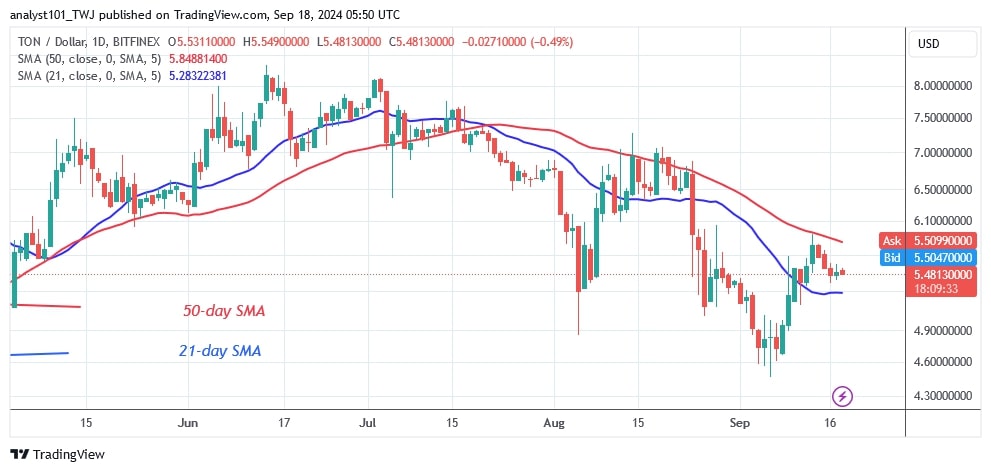
The upward correction ended at the high of the 50-day SMA or the $6.00 resistance. In other words, TON is currently trading above the 21-day SMA support but below the 50-day SMA resistance level.
If the current support and resistance levels are broken, the cryptocurrency will start a trend. The altcoin is now worth $5.53. If the 50-day SMA is broken, TON will rise to highs of $7.50 and $8.00. Conversely, TON will fall if the bears break below the 21-day SMA support.
The altcoin will crash and reach its previous low of $4.70 again. The altcoin is currently oscillating between moving average lines.
Toncoin indicator analysis
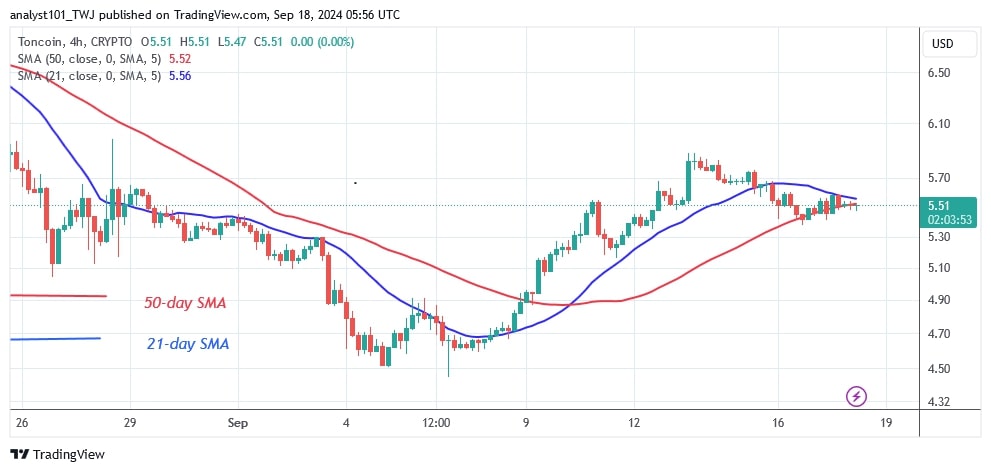
The cryptocurrency is trapped between the 21-day SMA support and the 50-day SMA resistance level. The altcoin will remain trapped for a few more days until the trend is determined. Doji candlesticks have formed and are gradually pushing the price higher.
Technical Indicators
Resistance Levels: $6.00, $8.00, $10.00
Support Levels: $5.00, $3.00, $1.00
What is the next move for Toncoin?
TON was in an uptrend that was halted by the 50-day SMA. The price signal suggests that the altcoin will fall even further if the bears manage to break below the 21-day SMA support. Currently, the altcoin has remained above $5.30, which is the 21-day SMA support.

Disclaimer. This analysis and forecast are the personal opinions of the author. They are not a recommendation to buy or sell cryptocurrency and should not be viewed as an endorsement by CoinIdol.com. Readers should do their research before investing in funds.


