- Bitcoin price has rallied 85% year-to-date, keeping 2023’s bullish momentum alive.
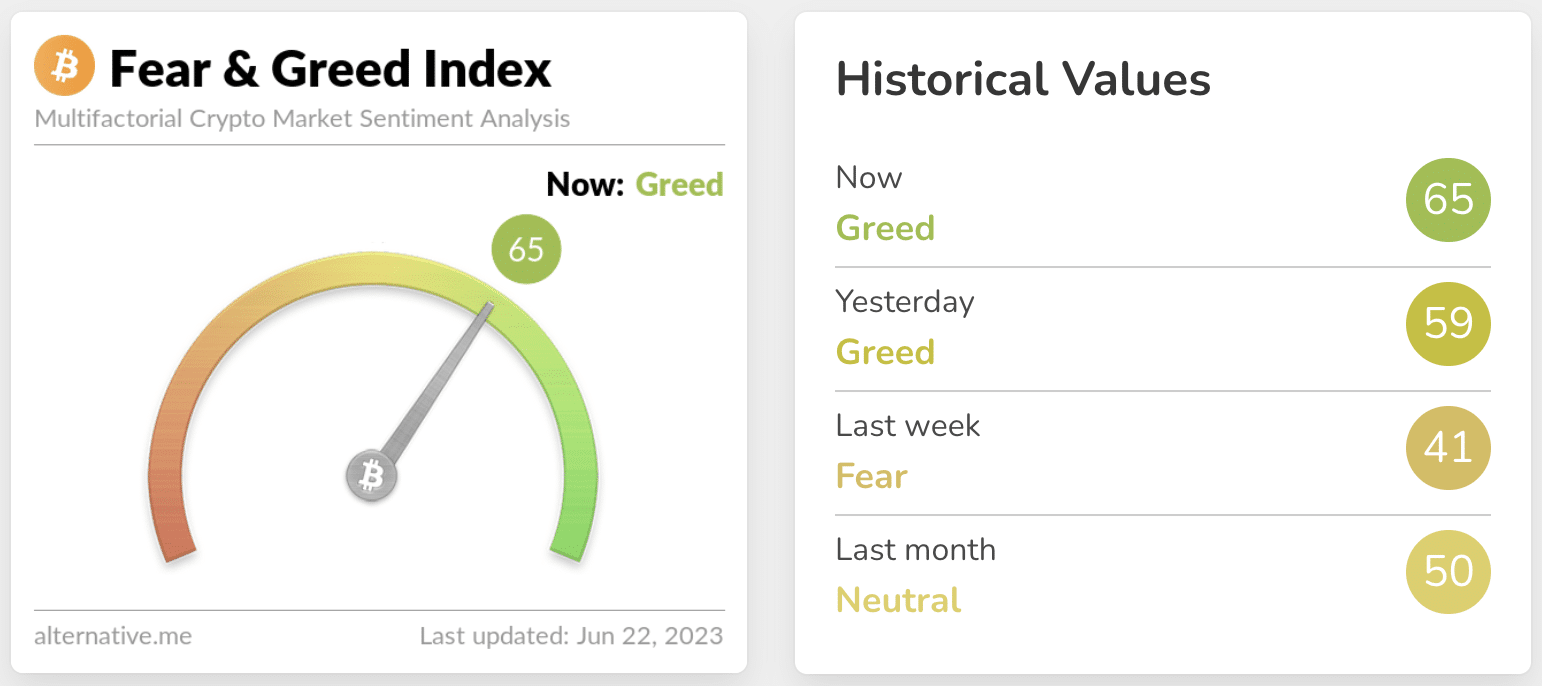
- Due to the strong uptrend seen over the last few weeks, the Fear and Greed Index has shifted to “greed.”
- But a look at on-chain metrics suggests that this move is just the beginning for BTC.
Bitcoin price has shown incredible resilience to short sellers over the last few weeks. With the second quarter of 2023 nearing its end, BTC has made an impressive comeback and is likely to continue pushing higher. But let us take a look under the hood to see if there are any threats to the ongoing bull rally especially after the Fear and Green Index hits “Greed” for the second consecutive day.
BTC Fear and Greed Index
Also read: Bitcoin dominance hits two-year high at 51%, jeopardizing altcoin gains
Bitcoin’s NUPL indicator hints at clear skies for bulls
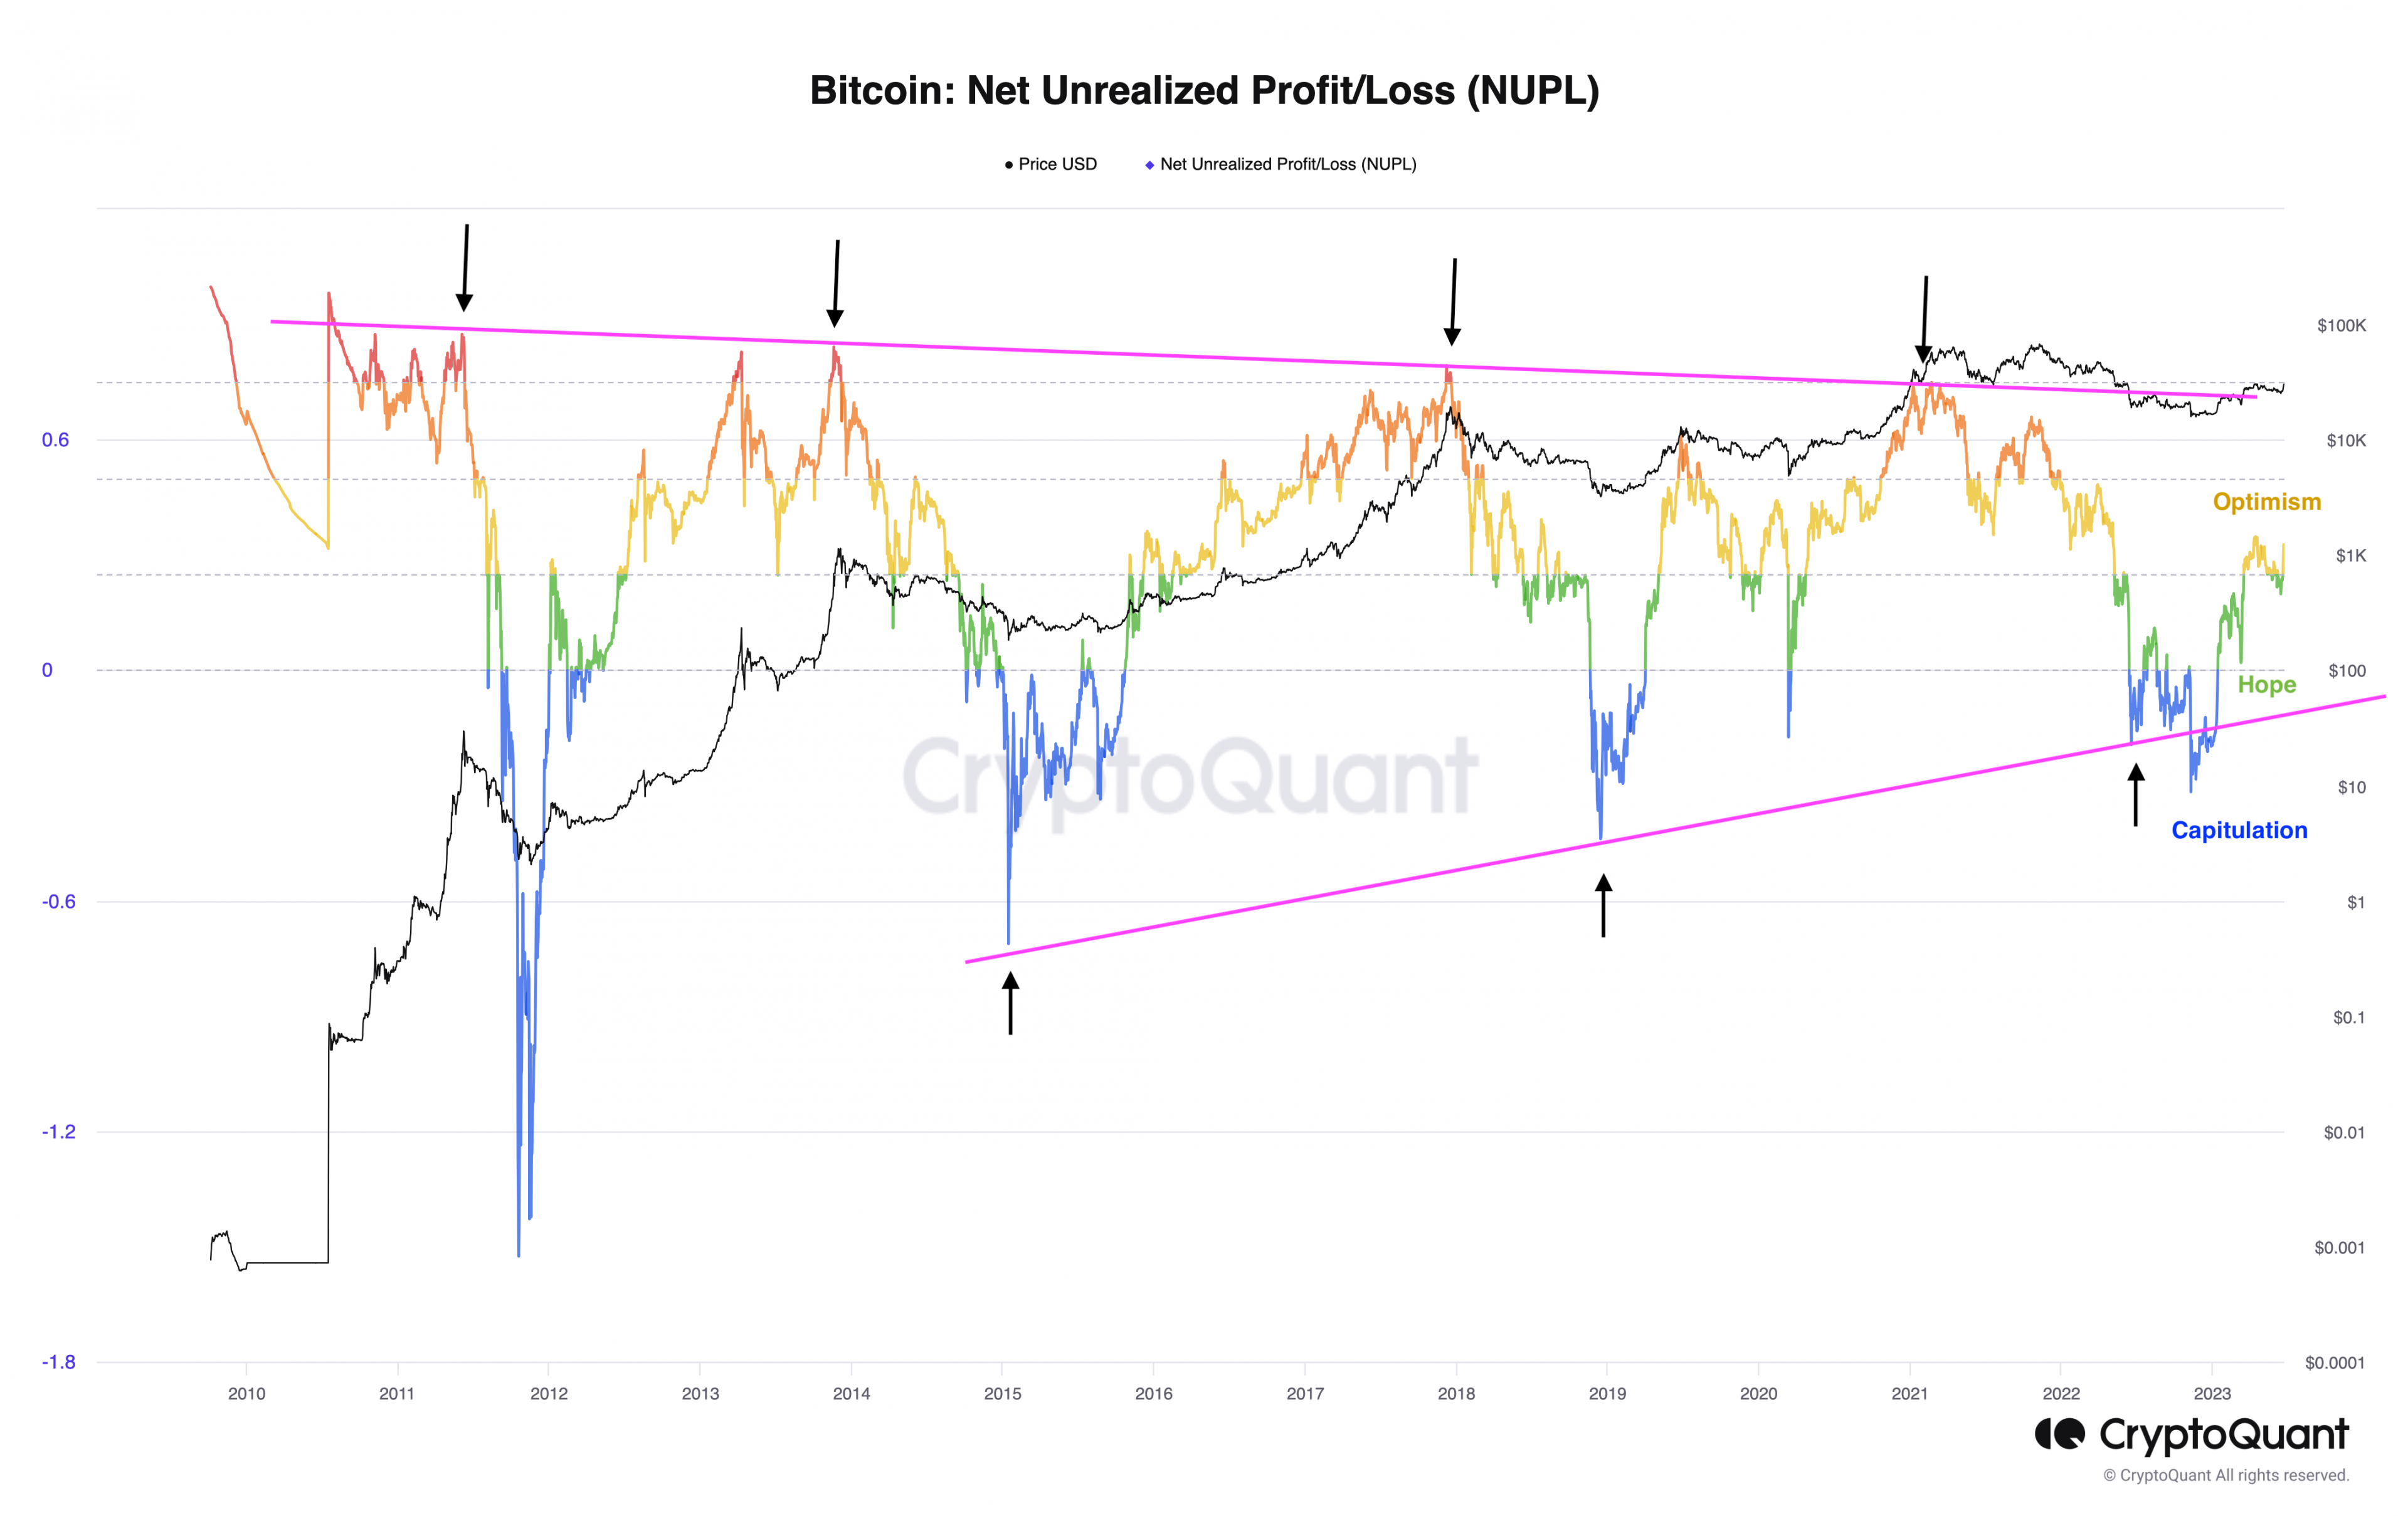
Bitcoin’s Net Unrealized Profit/Loss (NUPL) indicator is extremely useful in identifying the cycle tops and bottoms based on investors’ sentiment. Put simply, NUPL is the difference between unrealized profit and unrealized loss and is used to determine whether the holders are in a state of profit or loss.
Interestingly, the chart is split into different sentiments to better visualize if the rally is just starting or ending. The indicator enters the “Greed” stage when it detects high unrealized profits, which is often the best time to book profits. This phase is where corrections often accelerate, shifting the market sentiment from Greed to Denial, from Denial to Anxiety, from Anxiety to Fear, and from Fear to Capitulation. Capitulation typically marks the cycle bottom.
Since Bitcoin price marked a local bottom at roughly $15,487, the NUPL indicator has moved out of Capitulation and transitioned to Hope and currently sits at Optimism. If the rally continues to push higher, the NUPL will mature to Belief, which is the penultimate stage before the market cycle creates a top or an all-time high. Following Belief is the Euphoria and Greed phase, which will eventually lead to capitulation.
To conclude, the NUPL indicator suggests that Bitcoin’s 2023 rally has just begun.
BTC NUPL chart
MVRV indicator hints BTC has more room to upside
Another great on-chain tool that provides a clear overview of holders’ sentiment is the Market Value to Realized Value (MVRV) indicator.
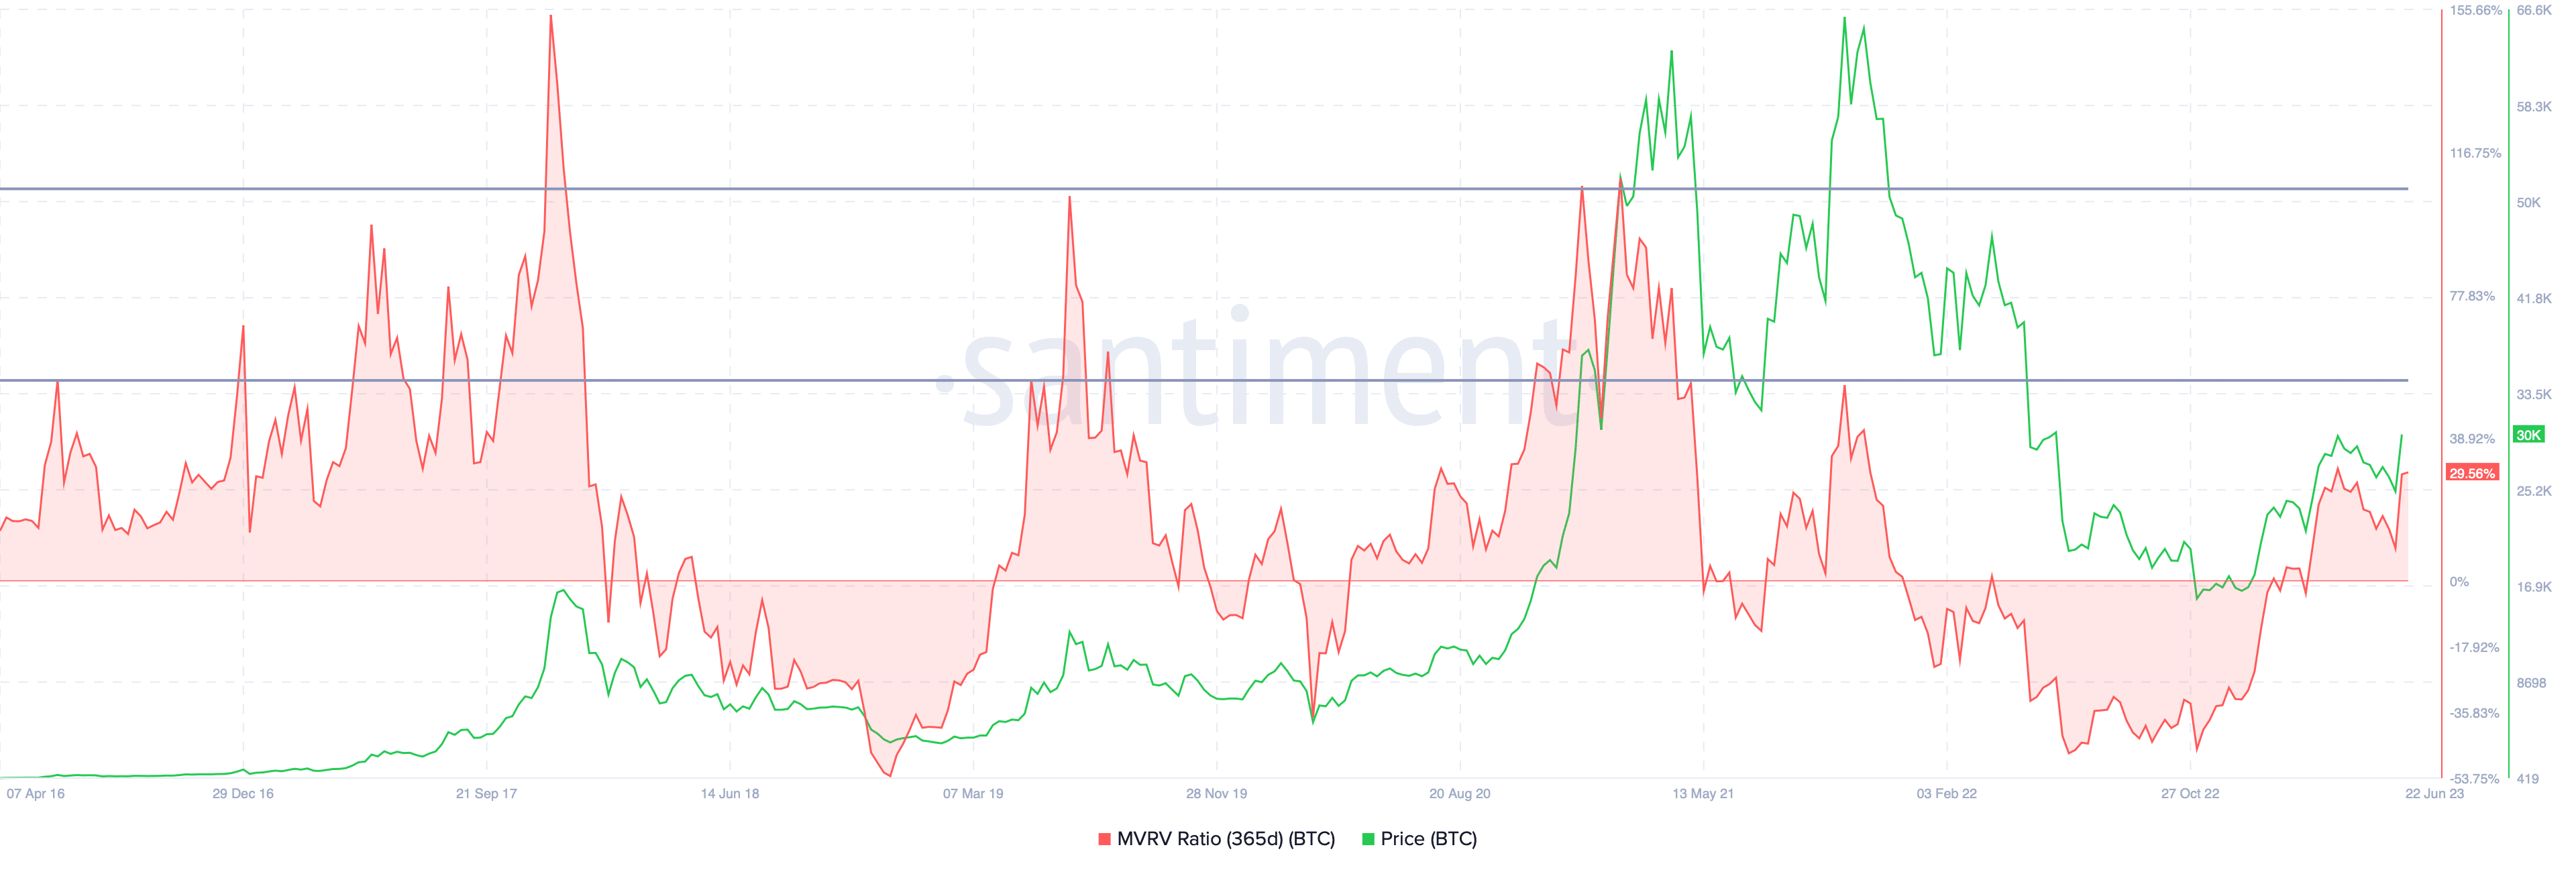
This on-chain metric is used to determine the average profit/loss of investors that purchased BTC over the past year. Based on Santiment’s research, “Opportunity Zone” is when short-term holders are at a loss, which is where long-term holders tend to accumulate. As the name indicates, “Danger Zone” is when the holders have high unrealized profits, posing the threat of a potential sell-off.
For Bitcoin, the 365-day MVRV chart shows two zones where local tops have formed -55% and -105%. Currently, the indicator sits at nearly 30%, suggesting that there is more room to the upside before unrealized profits become a threat to the ongoing rally.
BTC MVRV 365-day chart
Also read: Is Bitcoin’s 2023 bull rally at an end?
Bitcoin Whales are accumulating BTC
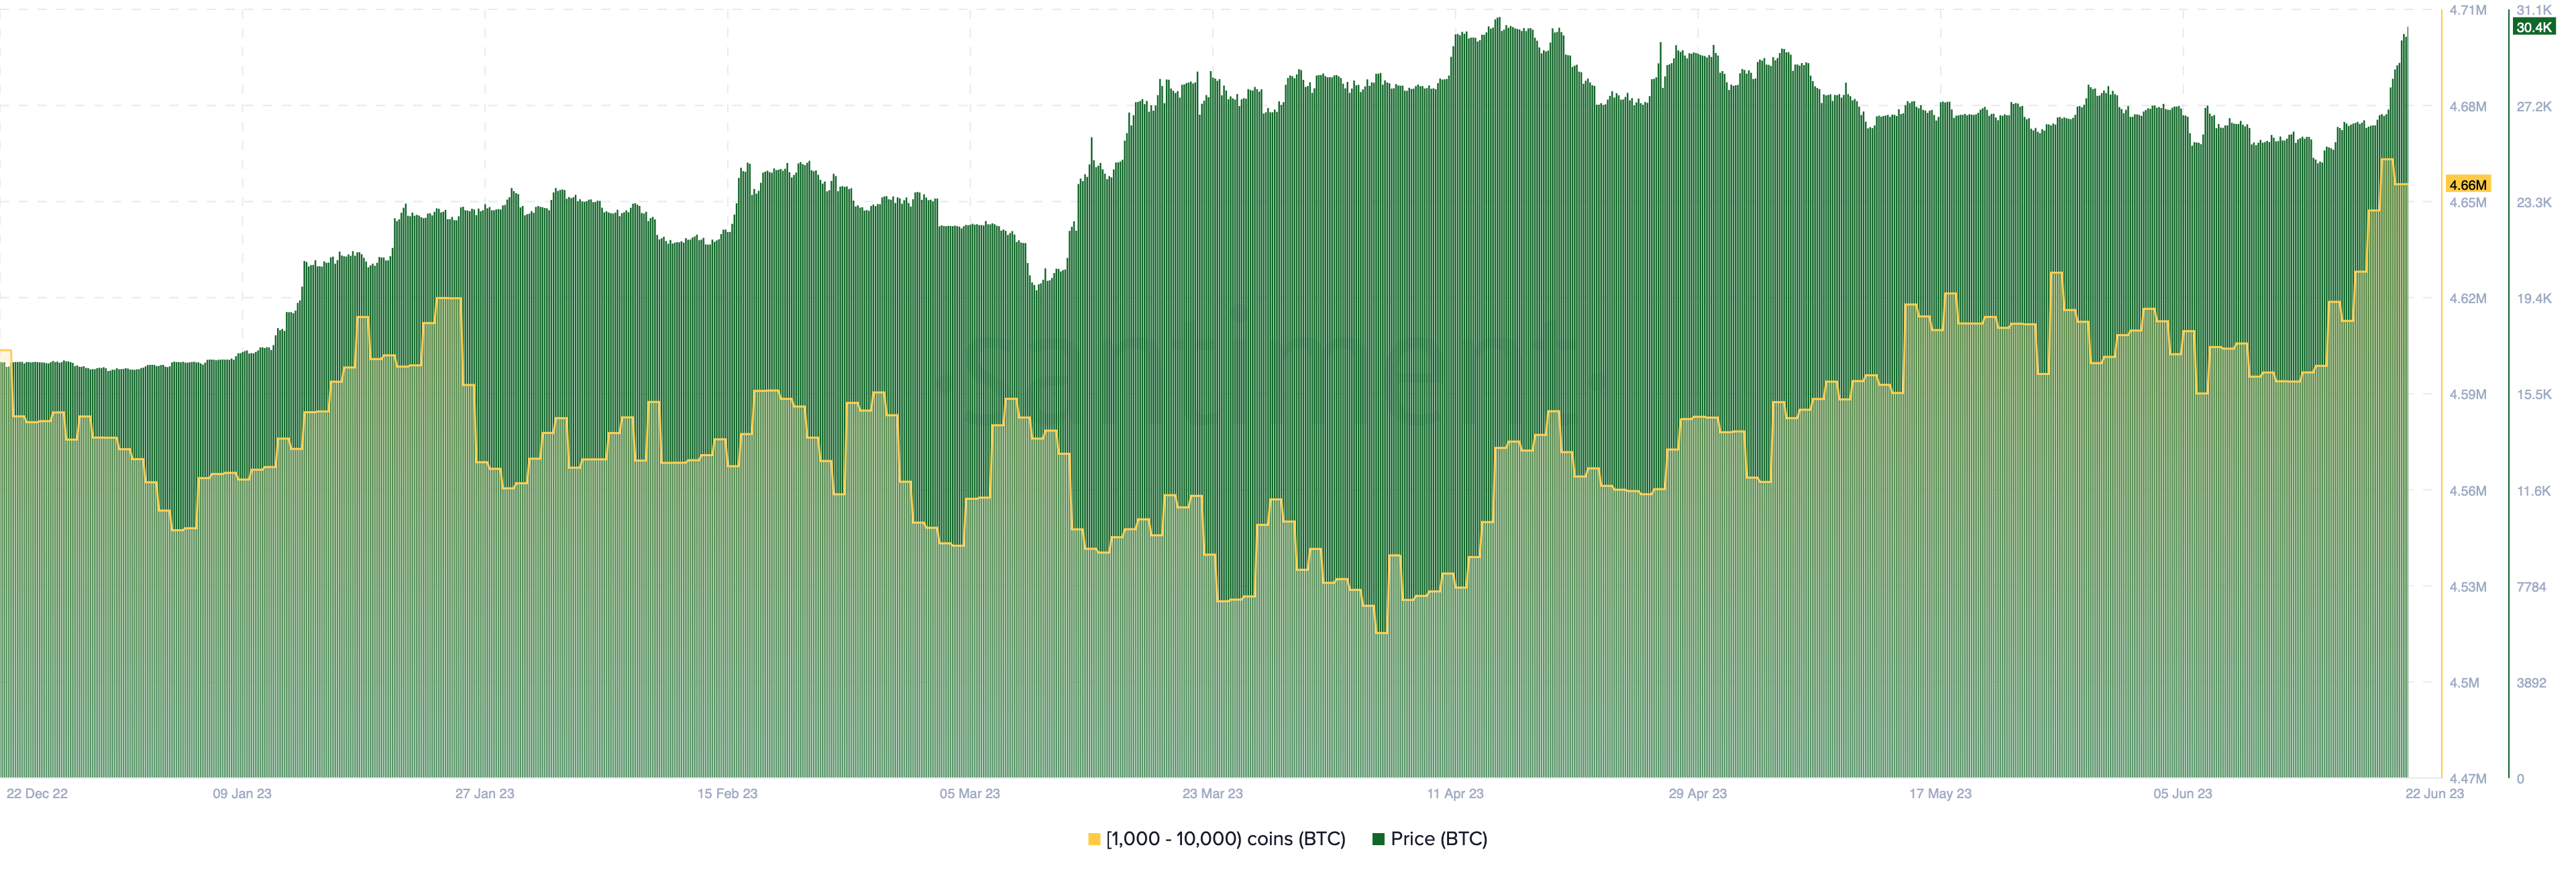
Sings of a promising rally is when long-term holders are seen accumulating. Currently, Bitcoin seems to be attractive to investors as whales holding between 1,000 to 10,000 BTC have increased 4.60 million to 4.67 million.
A total of 70,000 new addresses holding 1,000 to 10,000 BTC have spawned, suggesting new money coming into the market. This bullish development further enforces that the 2023 rally is just starting and that Bitcoin price could continue climbing higher.
BTC supply distribution chart
Also read: Recent Bitcoin price crash triggers whales to scoop BTC at discount
Additionally, CryptoQuant founder Ki Young Ju tweeted that the Bitcoin rally between June 19 and 22 was not as a result of short-squeeze but due to spot BTC buys.
In summation these data points all suggest but one thing – there is a real demand for Bitcoin. As a result, new capital is flowing into the market, which is the reason for the ongoing rally. Additionally, there is no threat to the upside as seen in the above on-chain metrics, which all suggest that there is more to the upside.


