For the past two weeks, Bitcoin has maintained its range-bound price movement. However, there are several indicators pointing toward an imminent breakout.
Technical Analysis
By Edris
The Daily Chart
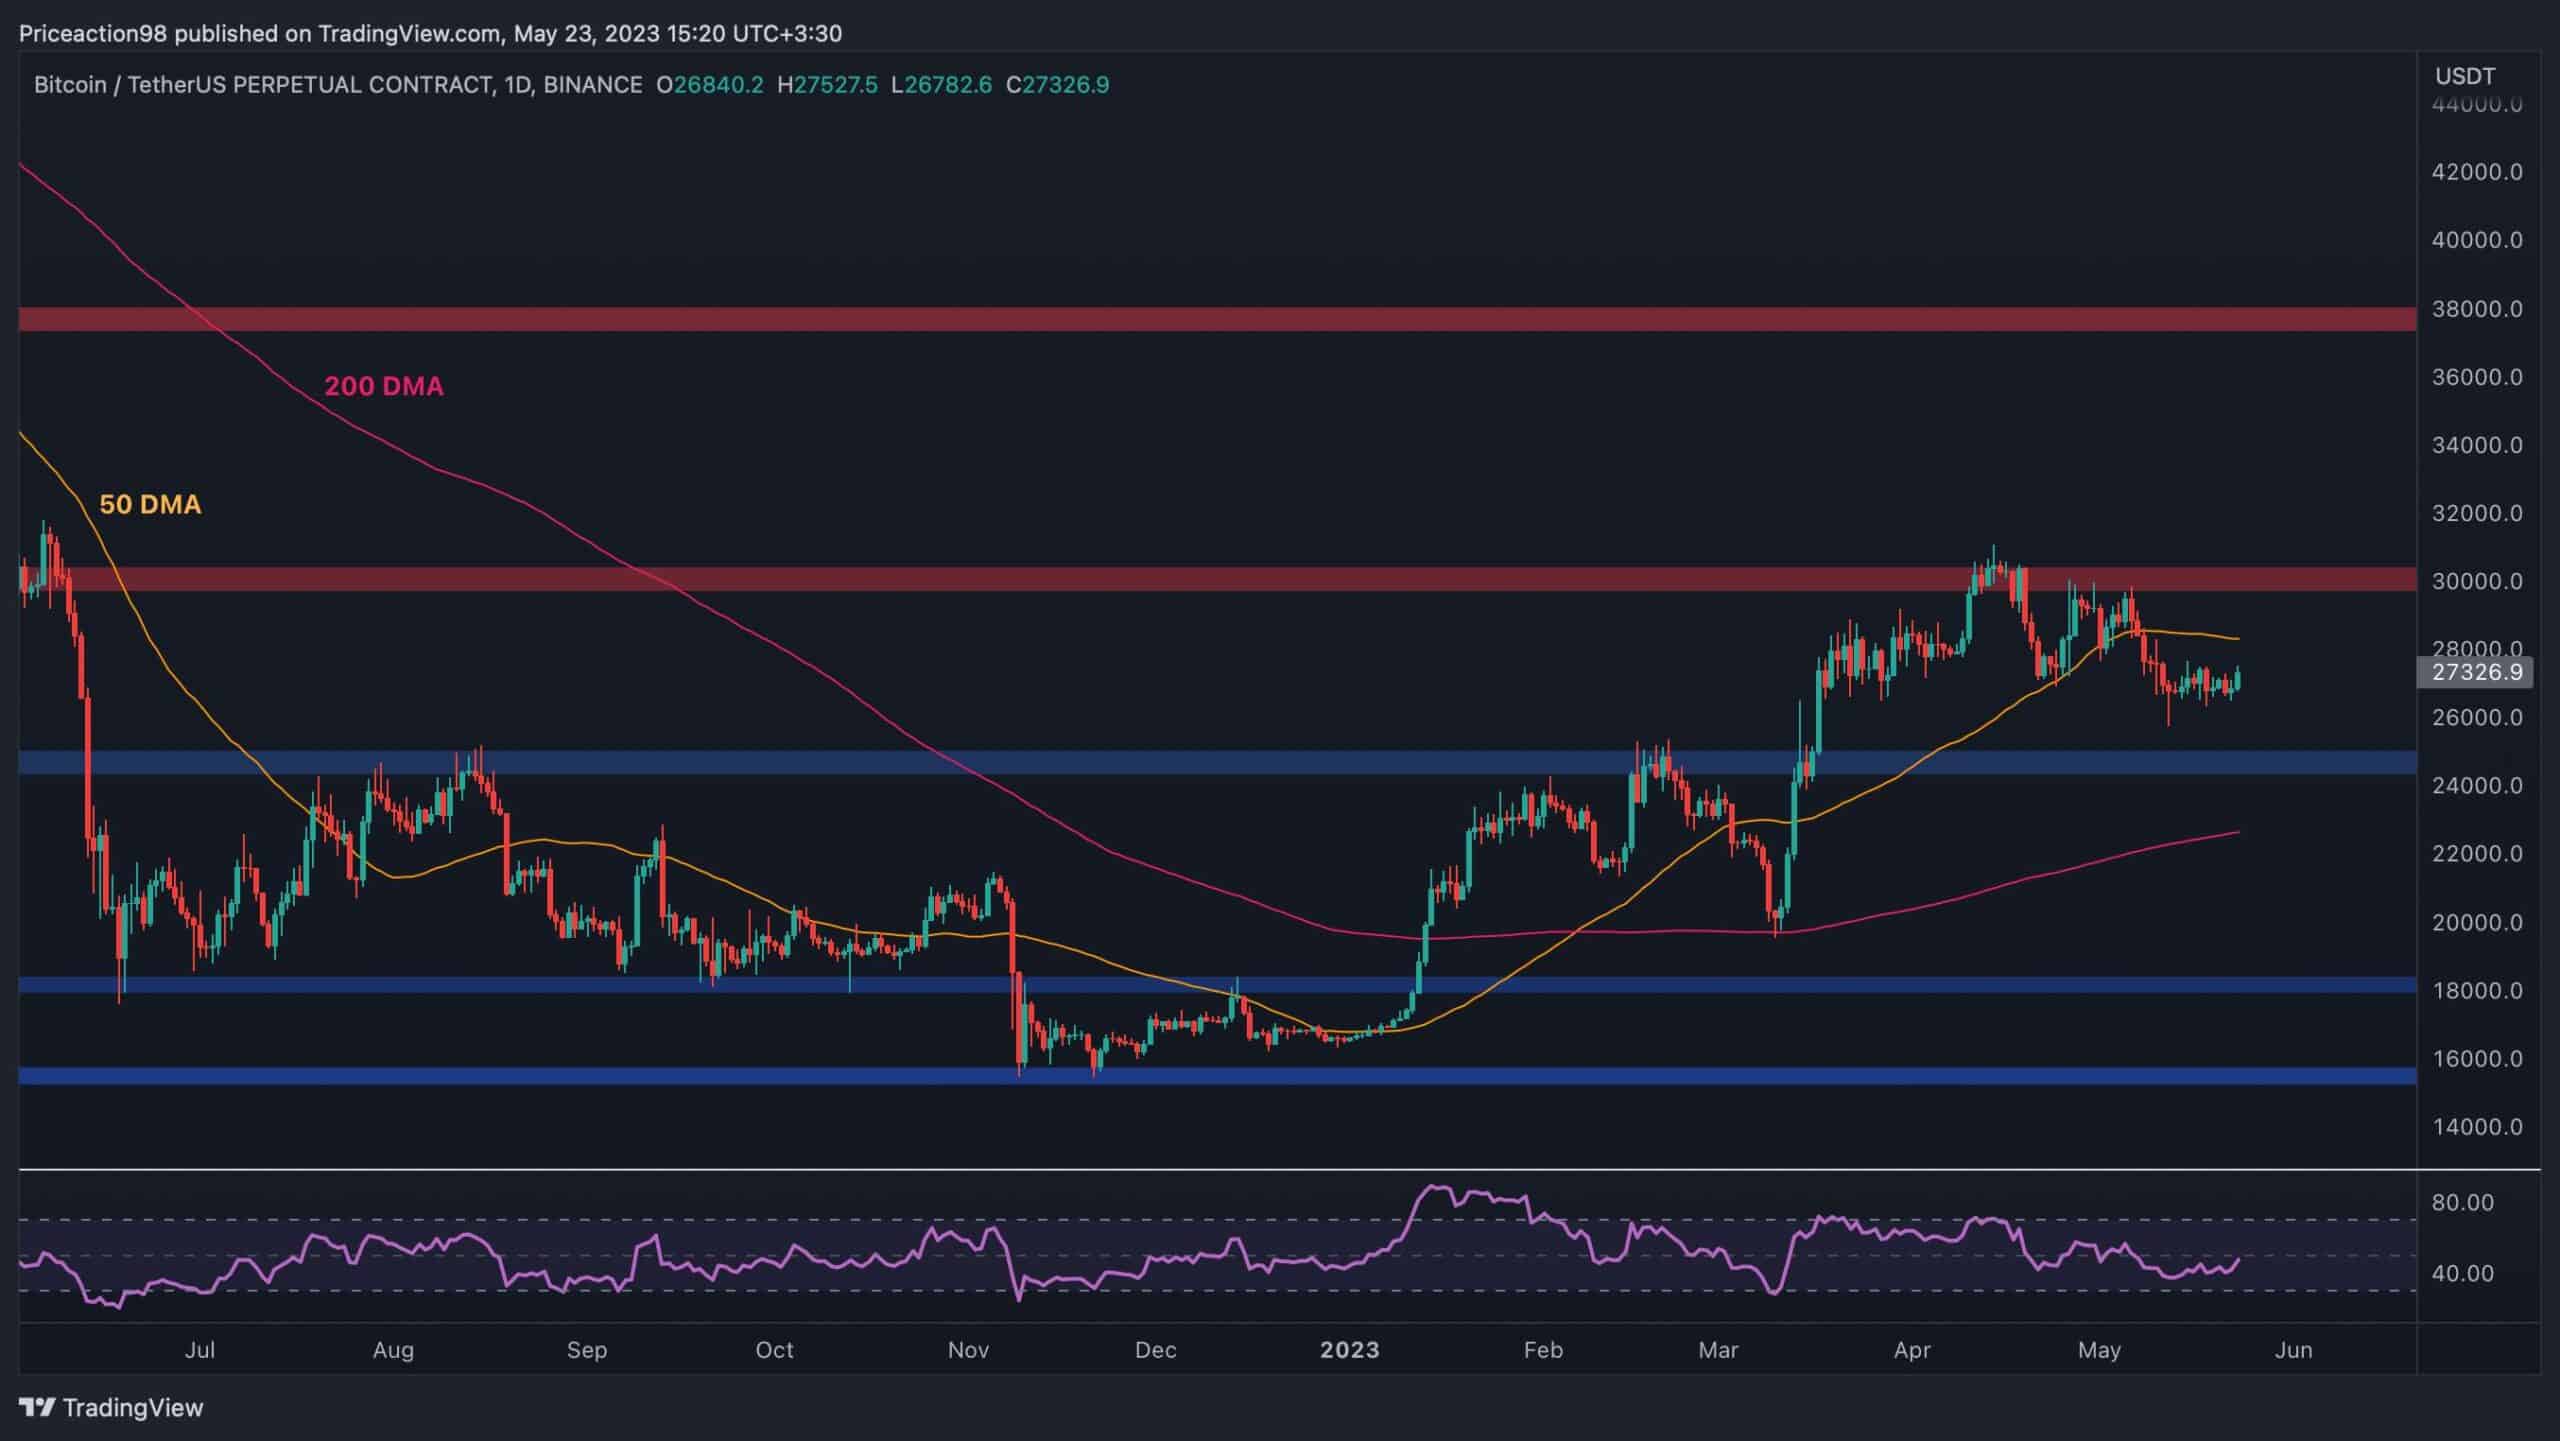
The price has been consolidating within a narrow range on the daily timeframe for the last 7 days. This consolidation follows the market’s downward rejection at the $30K resistance level and the subsequent breakdown of the 50-day moving average of around $29K.
Currently, the expected bearish target for the price is the $25K support level. However, there is a possibility that the price may first retest the 50-day moving average before continuing its decline toward $25K.
The RSI is also showing an upward trend and is approaching the 50% threshold, indicating a potential pullback toward the 50-day moving average or perhaps even another retest of the $30K resistance level in the coming weeks.
It’s worth noting that the latter scenario would likely invalidate the former, and a bullish breakout above the $30K level would then be more likely in this case.

The 4-Hour Chart
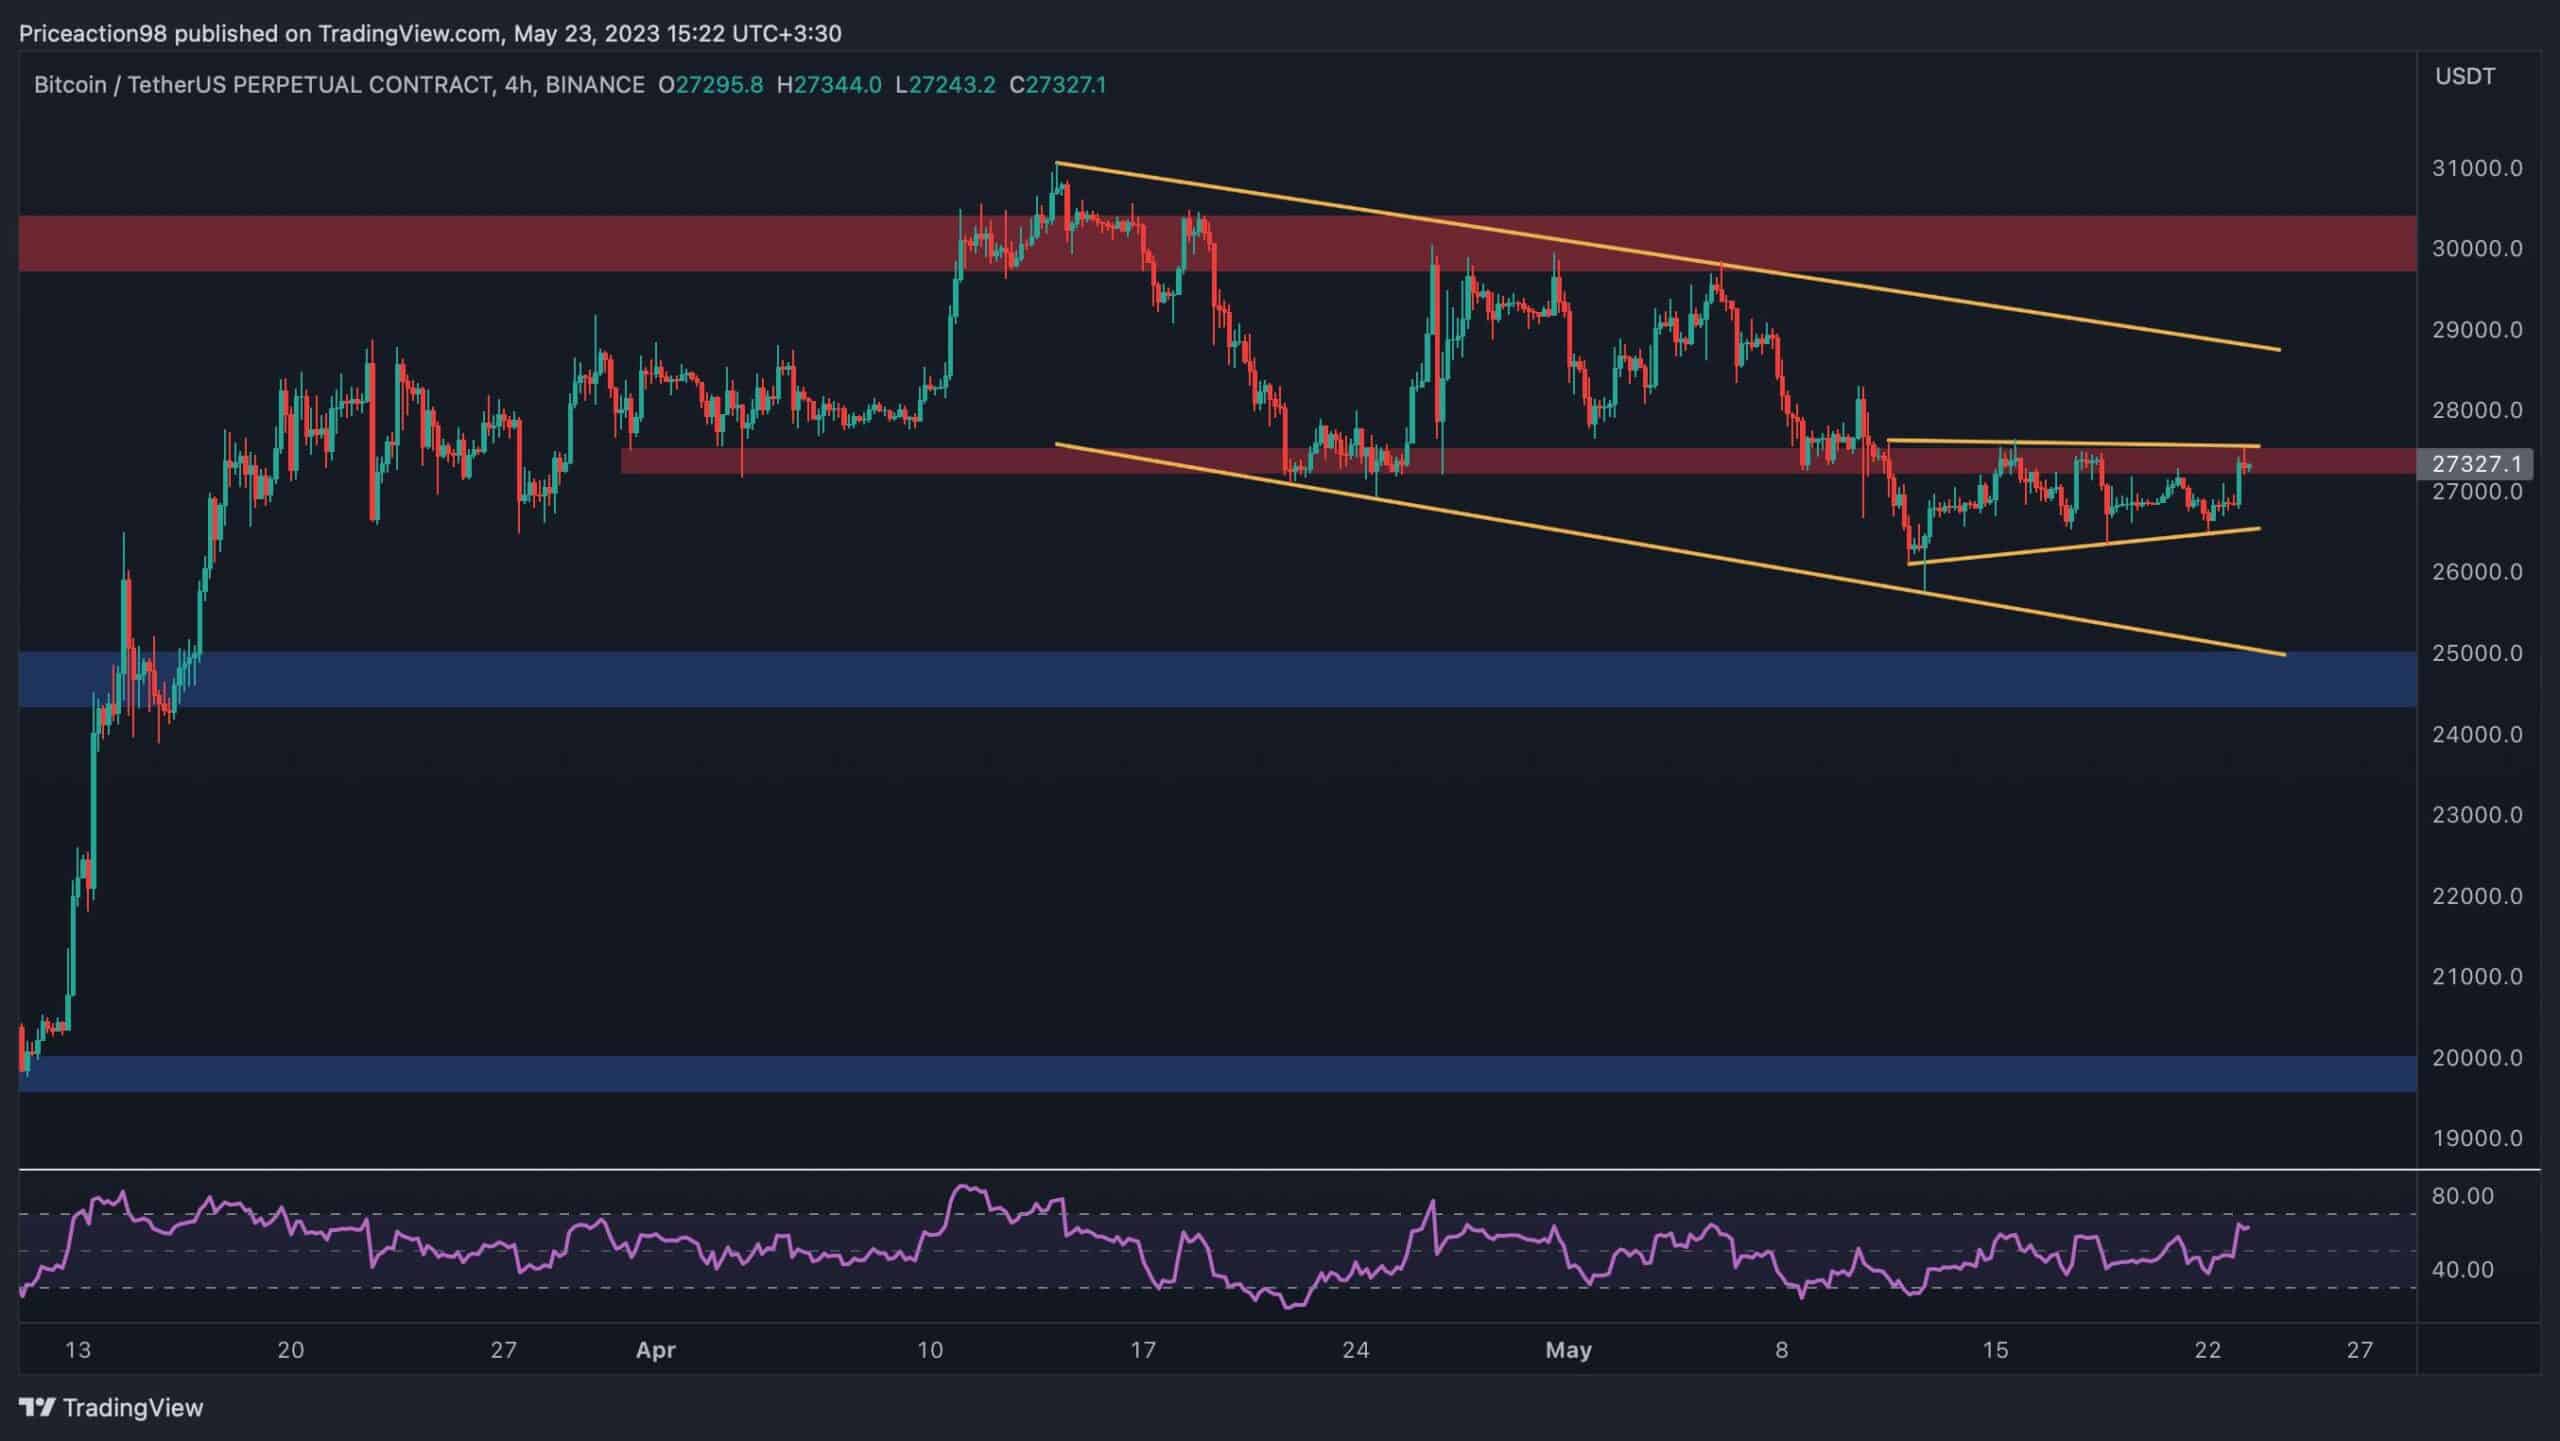
The 4-hour chart presents an intriguing situation. Currently, the price is undergoing a retest of both the $27,500 level and the upper boundary of a small bearish flag. If it faces another rejection, there is a strong likelihood of a decline towards the lower boundary of a larger channel and the $25K support level.
On the contrary, a breakout above this area would potentially result in a push out of the larger channel, followed by a subsequent retest of the $30K level in the near future.
Additionally, the RSI on this timeframe indicates bullish momentum with values above 50%, further enhancing the likelihood of the bullish scenario unfolding.

On-chain Analysis
By Shayan
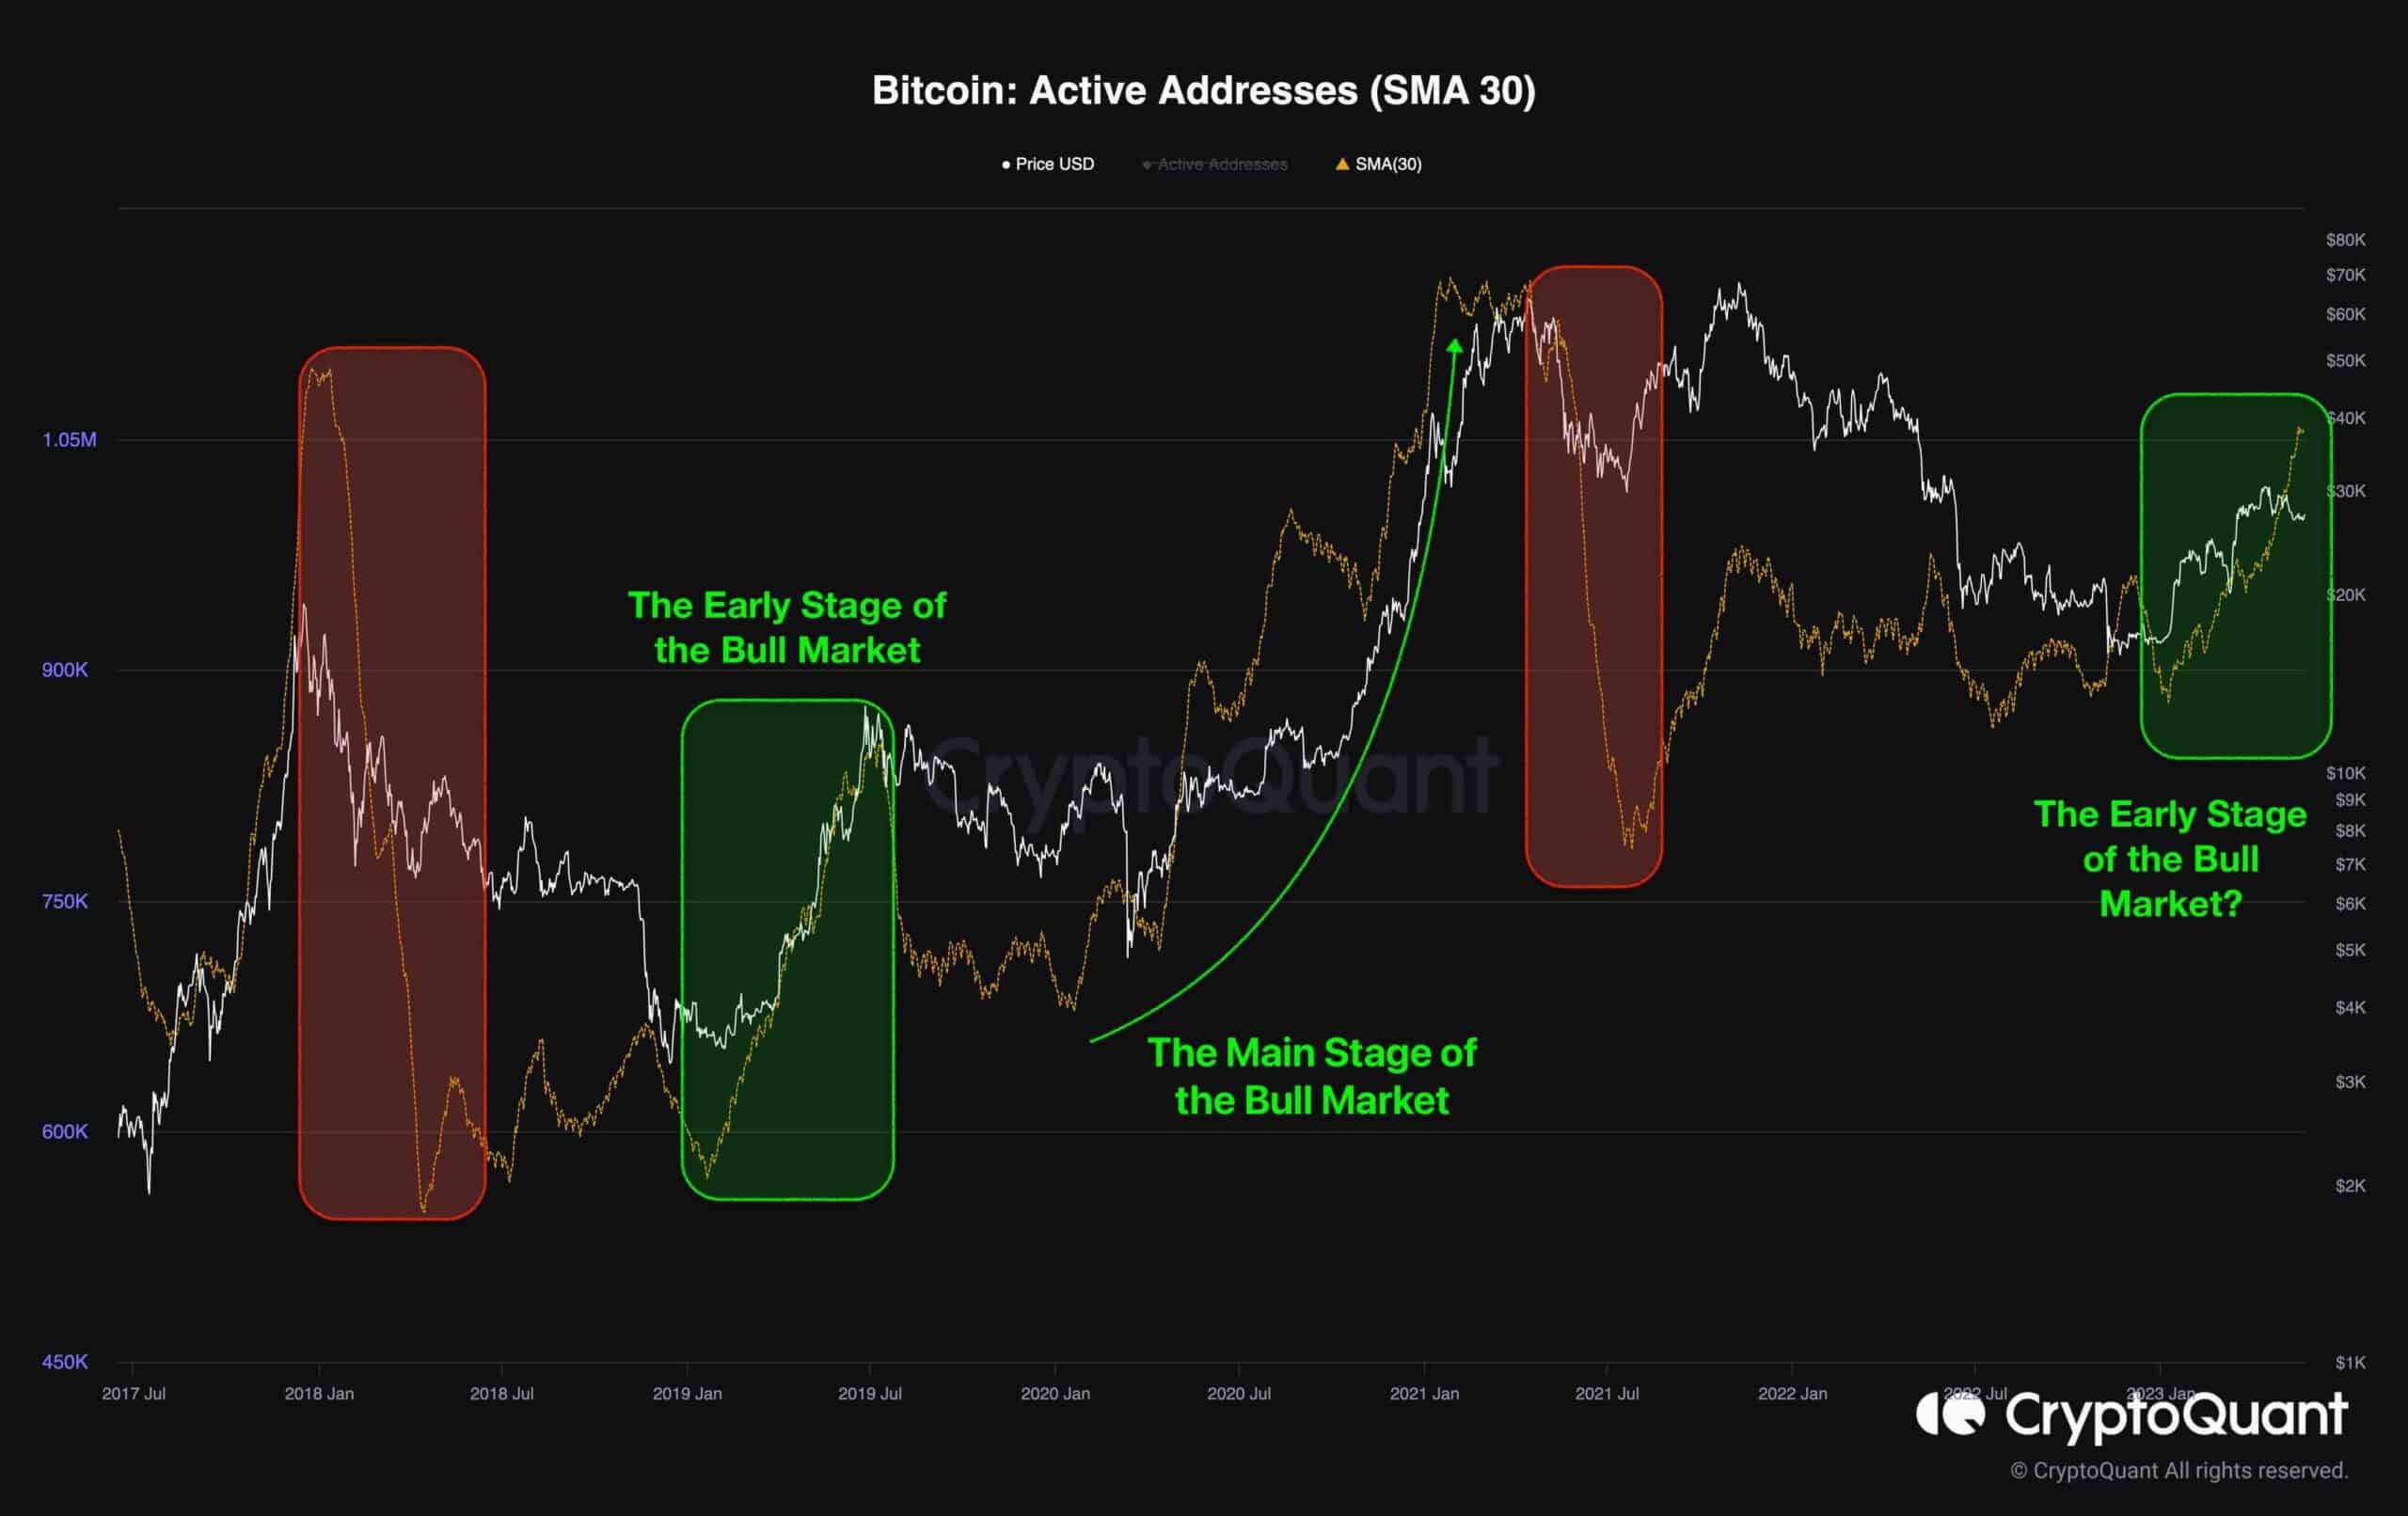
The graph below illustrates the Bitcoin Active Addresses metric, a 30-day moving average, alongside the BTC price since the bear market of 2017. This metric serves as an indicator of market demand. During bull runs, the demand for Bitcoin rises, leading to an increase in active addresses. Conversely, during bearish market phases, interest in the industry wanes, resulting in a decline in the active addresses metric.
Bitcoin’s recent behavior resembles its price action at the beginning of the 2019 bull market. However, after a period of consolidation, the metric began an upward trend simultaneously with a bullish mid-term rally in price, indicating growing demand for Bitcoin. This phase can be referred to as the early stage of the 2019 bull run, preceding the main stage in which active addresses experienced a sustained surge.
A similar pattern is unfolding currently as the metric continues to soar alongside Bitcoin’s upward movement. Based on the graph, it can be inferred that Bitcoin is potentially entering the early stage of its next bull run. Nevertheless, remaining aware of market risks and volatility during these periods is crucial.

Binance Free $100 (Exclusive): Use this link to register and receive $100 free and 10% off fees on Binance Futures first month (terms).
PrimeXBT Special Offer: Use this link to register & enter CRYPTOPOTATO50 code to receive up to $7,000 on your deposits.
Disclaimer: Information found on CryptoPotato is those of writers quoted. It does not represent the opinions of CryptoPotato on whether to buy, sell, or hold any investments. You are advised to conduct your own research before making any investment decisions. Use provided information at your own risk. See Disclaimer for more information.
Cryptocurrency charts by TradingView.


