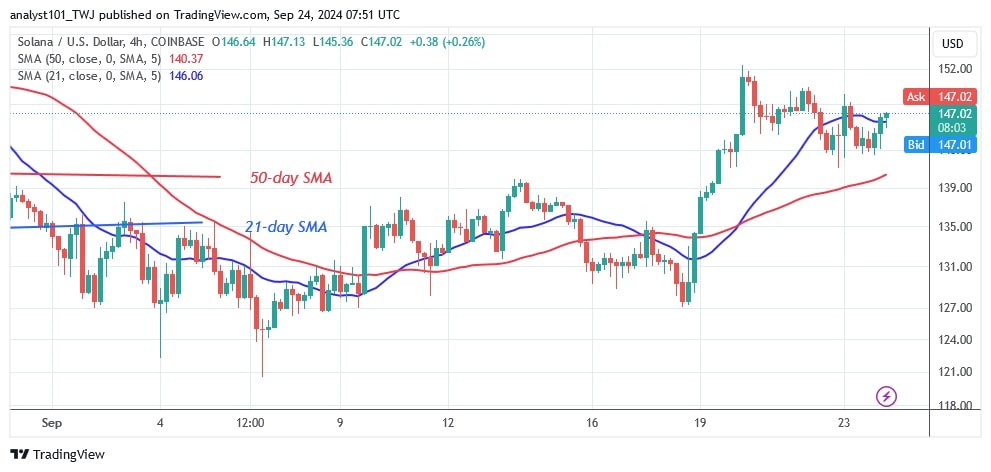
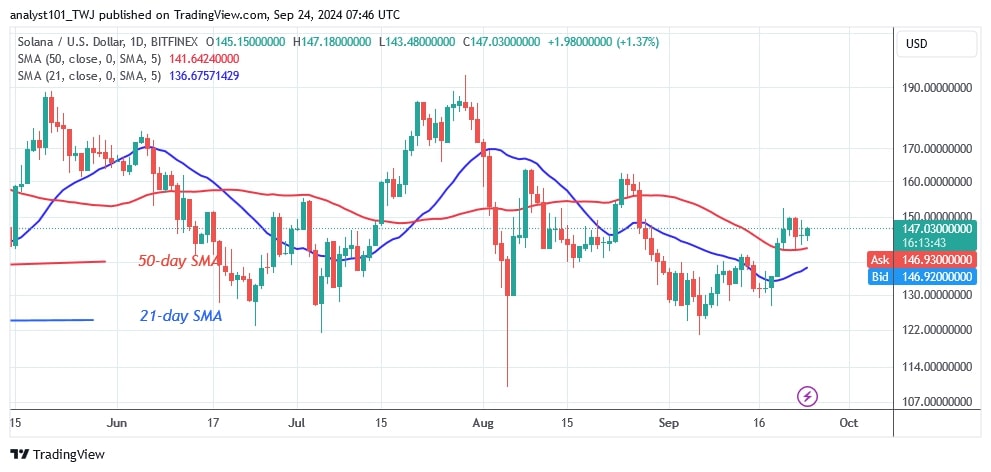
The price of Solana (SOL) is in an uptrend after rising above the moving average lines on September 19.
Long-term forecast for the Solana price: bullish
On September 21, the uptrend hit an early obstacle at $150 before returning above the moving average lines. Today, the altcoin is rising to the first barrier of $150, signaling the start of an uptrend. If the current barrier is breached, Solana will rise to the next resistance of $160.
However, the bulls have not broken through the next resistance level of $160 since August 8. Moreover, once the first barriers are overcome, the market will return to its previous highs between $185 and $190. In the meantime, Solana is trading above the moving average lines but below the $150 level. It is currently trading at $147.55.
Analysis of SOL price indicators
After the recent rally, the price bars are back above the moving average lines. SOL is rising as the price bars remain above the moving average lines. The sideways trend means that the moving average lines are horizontal. Solana continues to trade between the $120 support and the $190 resistance.
Technical indicators
Key supply zones: $200, $220, $240
Key demand zones: $120, $100, $80
What is the next move for Solana?
On the 4-hour chart, Solana is in an uptrend. The uptrend has paused at $150. The price of the cryptocurrency is bouncing above the $143 support and below the $152 resistance level. According to the price indications, the altcoin is expected to hit a high of $160. The upward movement will start when the current barrier is broken.
Last week Solana was trading in the downtrend zone between the current support level of $120 and the moving average lines.

Disclaimer. This analysis and forecast are the personal opinions of the author. They are not a recommendation to buy or sell cryptocurrency and should not be viewed as an endorsement by CoinIdol.com. Readers should do their research before investing in funds.


