Cryptocurrency price analysis brought by Coinidol.com. Solana (SOL) is trading sideways below the $20.50 level.
Solana long-term price forecast: bearish
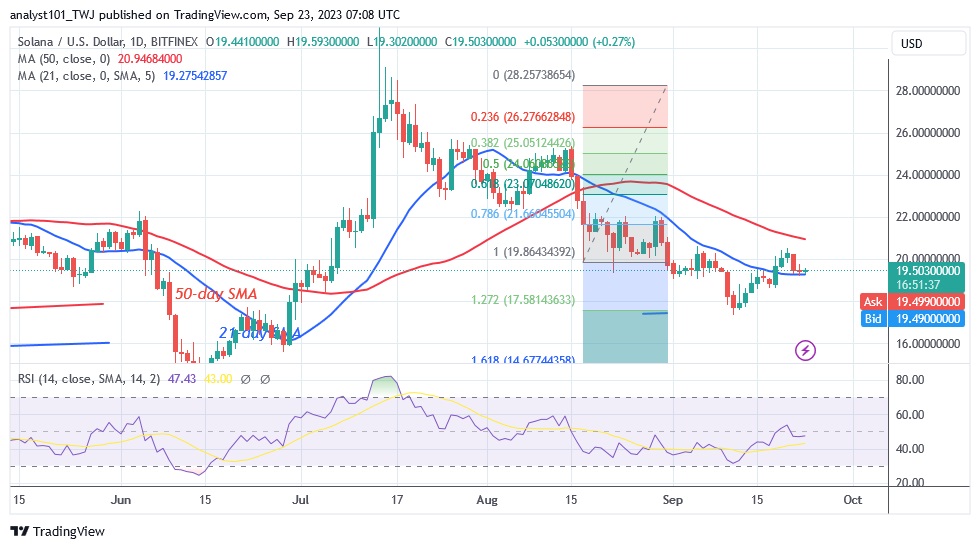
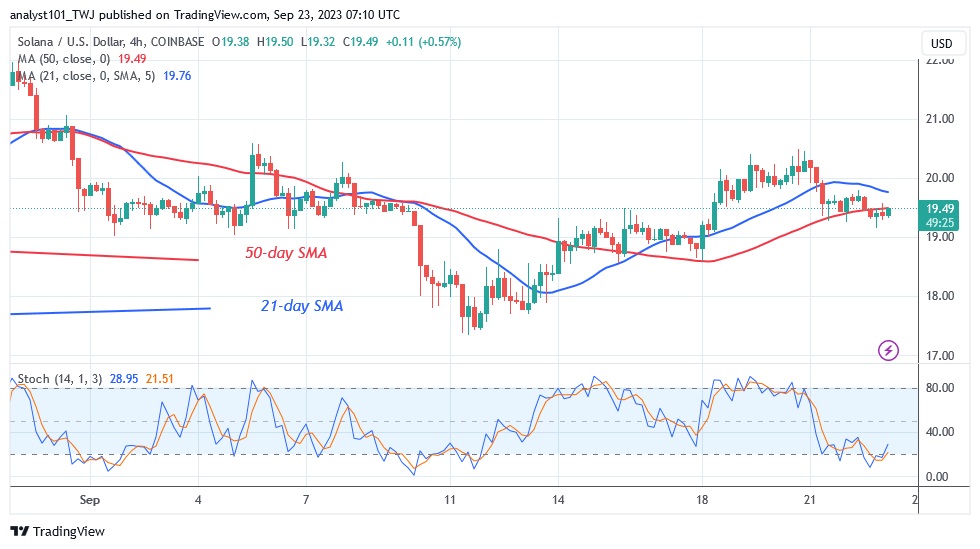
Since September 5, resistance at $20.50 has halted the upward movement. Solana experienced resistance on September 21 when it fell above $19 support. Solana is caught between the moving average lines, but the $19 support is holding. When the moving average lines are broken, the price of the cryptocurrency will evolve. Currently, the current support is an oversold market zone. Buyers are expected to show up in the oversold zone and push the price higher. If the buyers keep the price above the 50-day moving average line, Solana will resume its uptrend.
Solana price indicator analysis
Solana has entered the downtrend area at 47 on the Relative Strength Index. As the altcoin is trading between the moving average lines, it is forced to stay within a trading range as long as it is in the bearish trend zone. The cryptocurrency asset is already trading in the oversold zone of the market. It is below the daily stochastic value of 20.

Technical indicators
Key supply zones: $20, $25, $30
Key demand zones: $10, $5, $1
What is the next move for Solana?
Solana is trapped between the moving average lines and is trading above the $19 support. If the bears break the $19 support or the 21-day $MA, the altcoin is at risk of falling. In the meantime, the price movement is limited as it is trapped between the moving average lines.

As we reported on September 20, the price of the cryptocurrency has retested the high of $19 since September 15. Buyers have failed to keep the price above the recent high.
Disclaimer. This analysis and forecast are the personal opinions of the author and are not a recommendation to buy or sell cryptocurrency and should not be viewed as an endorsement by CoinIdol.com. Readers should do their research before investing in funds.


