The price of Solana (SOL) is falling below the moving average lines.
Solana price long-term forecast: bearish
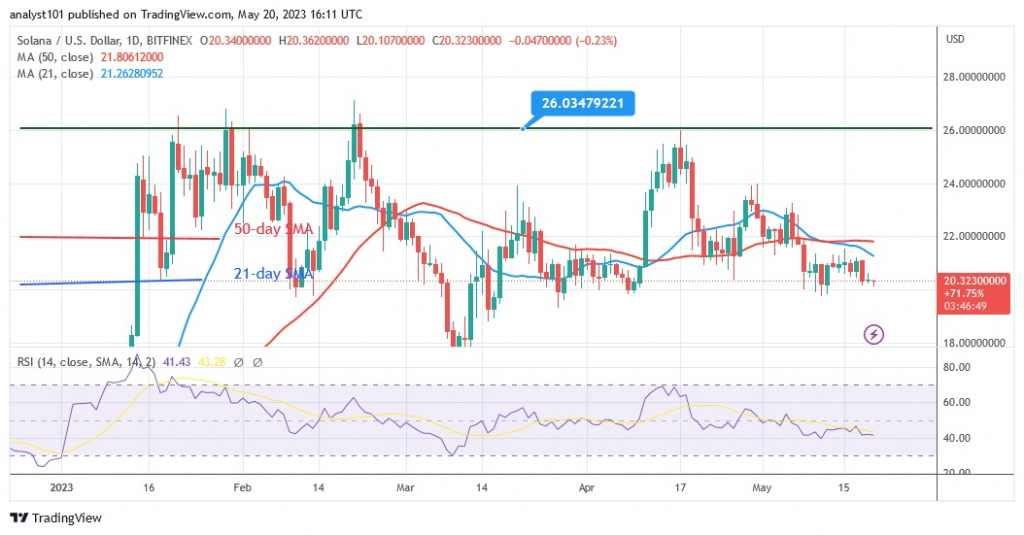
Solana has fallen to $20 since May 8 and is now consolidating back above current support. The current support was retested by the bears more than three times last week, but could not be breached. Since March 27, current support has not been threatened. Buyers have consistently defended the current support. However, a price signal suggests that the cryptocurrency will continue its downward trend. Solana could fall even further and reach a low of $18.
Solana price indicator analysis
Solana is at level 41 of the Relative Strength Index for period 14. The cryptocurrency is circling around the level of $20, which is currently serving as support. The current decline is due to the price bars remaining below the moving average lines. Solana is moving below the daily stochastic threshold of 20, indicating that the oversold area of the market has been reached.

Technical indicators
Key supply zones: $60, $80, $100
Key demand zones: $50, $30, $10
What is the next move for Solana?
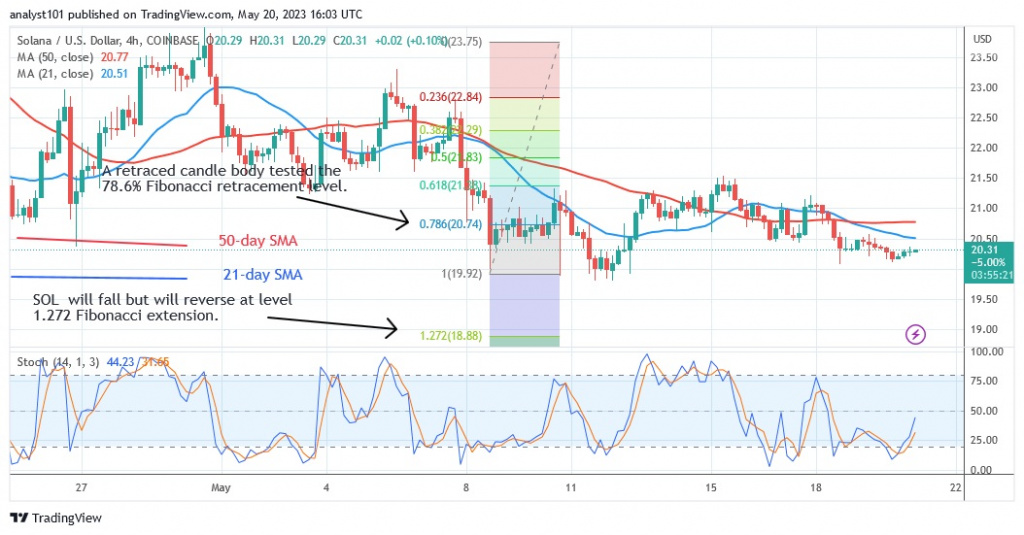
In the downtrend area, Solana is bearish. On the 4-hour chart, according to the price indicator, Solana will continue to go down. SOL has reversed up after the May 8 price decline and a candlestick has tested the 78.6% Fibonacci retracement level. According to the correction, SOL will fall, but will reverse at the level of the 1.272 Fibonacci extension, i.e. at $18.88.

Disclaimer. This analysis and forecast are the personal opinions of the author and are not a recommendation to buy or sell cryptocurrency and should not be viewed as an endorsement by CoinIdol. Readers should do their own research before investing in funds.


