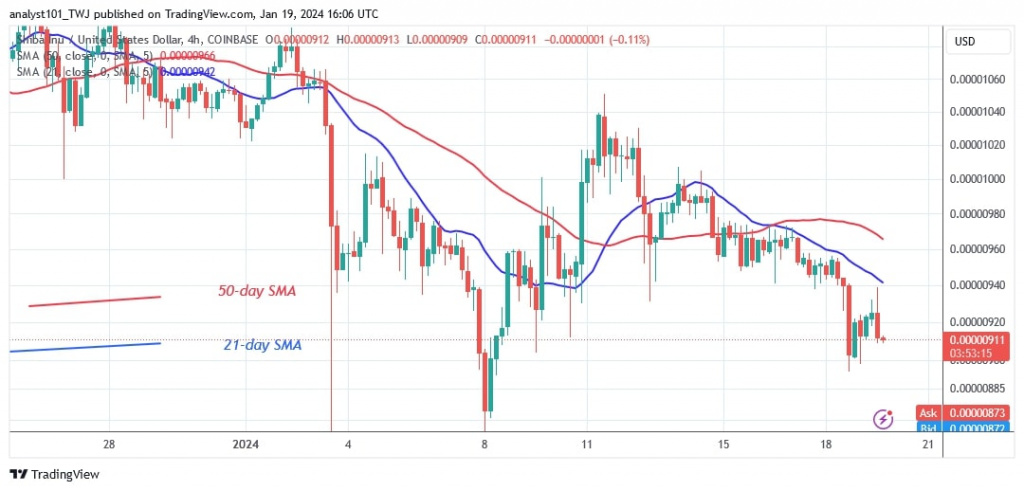
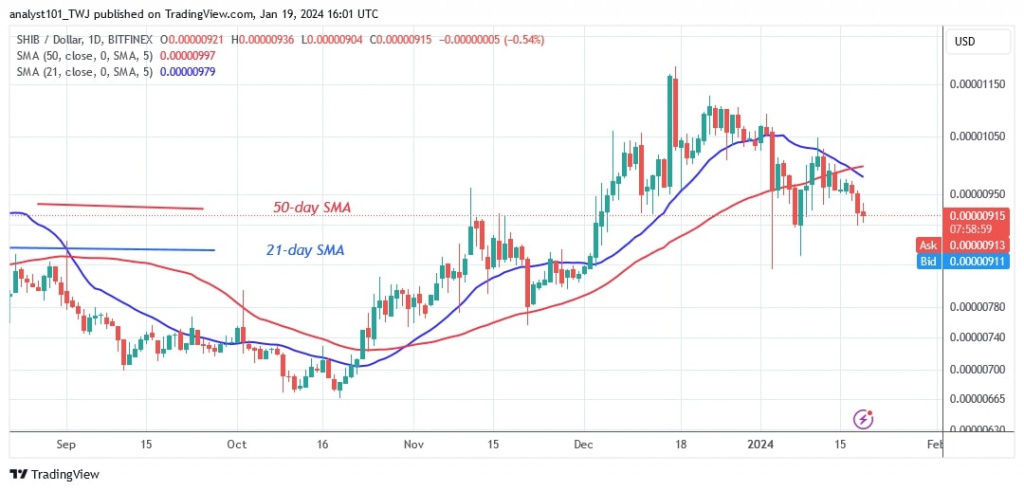
The cryptocurrency has retreated and is retesting the current support level of $0.00000890. According to price analysis by Coinidol.com, the bears tested the current support three times as the cryptocurrency rose above it.
Shiba Inu price long term prediction: bearish
The cryptocurrency is currently trading below the moving average lines at 0.00000890 and 0.00001000. SHIB will resume its sideways movement if the existing support holds. The altcoin will rise and reach its previous high again. However, if the bears break below the current support, the market will drop to a low of $0.00000840.
Analysis of the Shiba Inu indicator
The price bars are below the moving average lines, but the selling pressure has eased. The moving average lines on both charts are sloping downwards, indicating a downtrend. SHIB is showing a bearish crossover with the 21-day SMA falling below the 50-day SMA. This offers traders the opportunity to sell.
Technical indicators
Key resistance levels: $0.00001200, $0.00001300, $0.00001400
Key support levels: $0.00000600, $0.00000550, $0.00000450
What’s next for Shiba Inu?
SHIB is bearish but above support at $0.00000890. Cryptocurrency price is recovering, with long candlestick tails indicating current support. The long candlestick tail signals significant buying pressure near $0.00000890.
On January 14, Coinidol.com reported that previously the moving average lines and resistance at $0.00001050 have resisted the upward correction.

Disclaimer. This analysis and forecast are the personal opinions of the author and are not a recommendation to buy or sell cryptocurrency and should not be viewed as an endorsement by CoinIdol.com. Readers should do the research before investing in funds.


