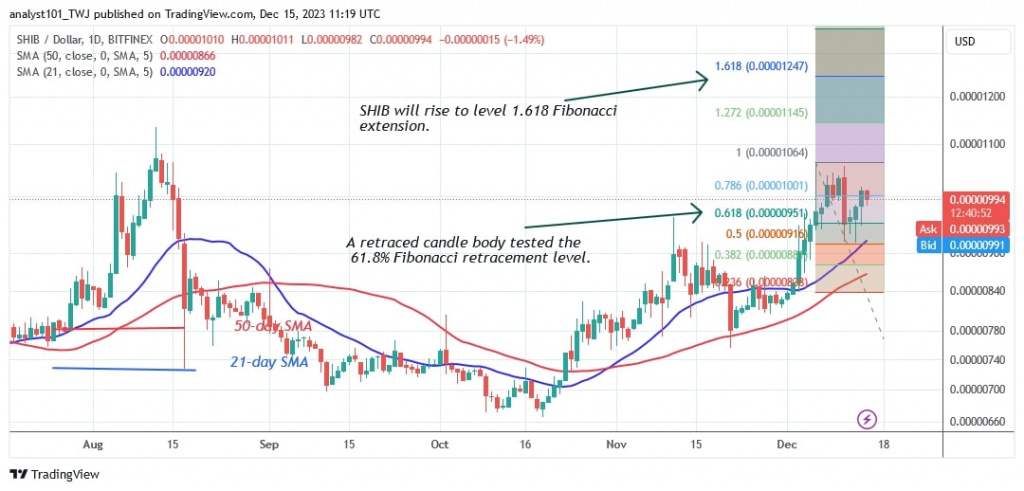
According to the price action, the upward movement of Shiba Inu (SHIB) has come to an end after reaching a high of $0.00001017.
Shiba Inu (SHIB) Price Long Term Prediction: Bullish
The price of Shiba Inu has resumed its uptrend after retreating from the upswing on December 11. The market hit a low of $0.00000919 on Dec. 11 as bulls bought the dips. The market will rally to a high of $0.00001250 if SHIB breaks the $0.00001050 barrier. In addition, a candlestick body of the Dec. 6 rally tested the 61.8% Fibonacci retracement line. The retracement suggests that the altcoin will rise to the 1.618 Fibonacci extension or $0.00001247.
Shiba Inu Indicator Analysis
The current rise on the 4-hour chart has been halted since December 6. The moving average lines now show a horizontal slope. The price bars are oscillating together with the moving average lines but are located between them. This indicates that the cryptocurrency will continue to trend sideways.
Technical indicators
Key Resistance levels: $0.00001200, $0.00001300, $0.00001400
Key Support levels: $0.00000600, $0.00000550, $0.00000450
What is the next move for Shiba Inu?
After the breakdown of the uptrend on December 6, SHIB/USD is trading in the uptrend zone between $0.00000920 and $0.00001050. The altcoin remains in the bullish trend zone on the daily chart as long as the price bars are above the moving average lines. If the resistance and support levels are broken, the altcoin will enter the trend.

Disclaimer. This analysis and forecast are the personal opinions of the author and are not a recommendation to buy or sell cryptocurrency and should not be viewed as an endorsement by CoinIdol.com. Readers should do the research before investing in funds.


