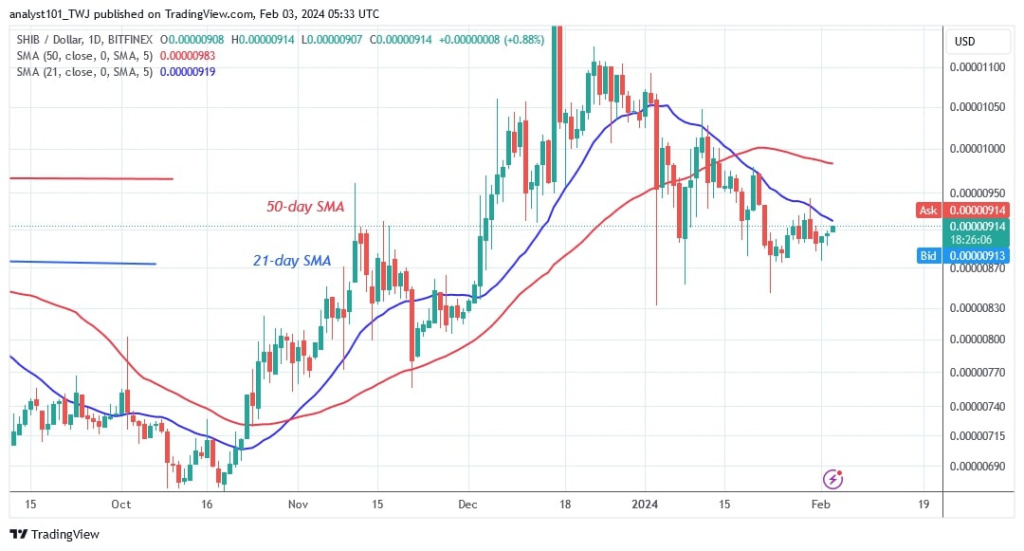
Shiba Inu (SHIB) price has reached bearish fatigue after holding above the $0.00000870 support level. The moving average lines have capped the upside.
Long-term forecast for the Shiba Inu price: bearish
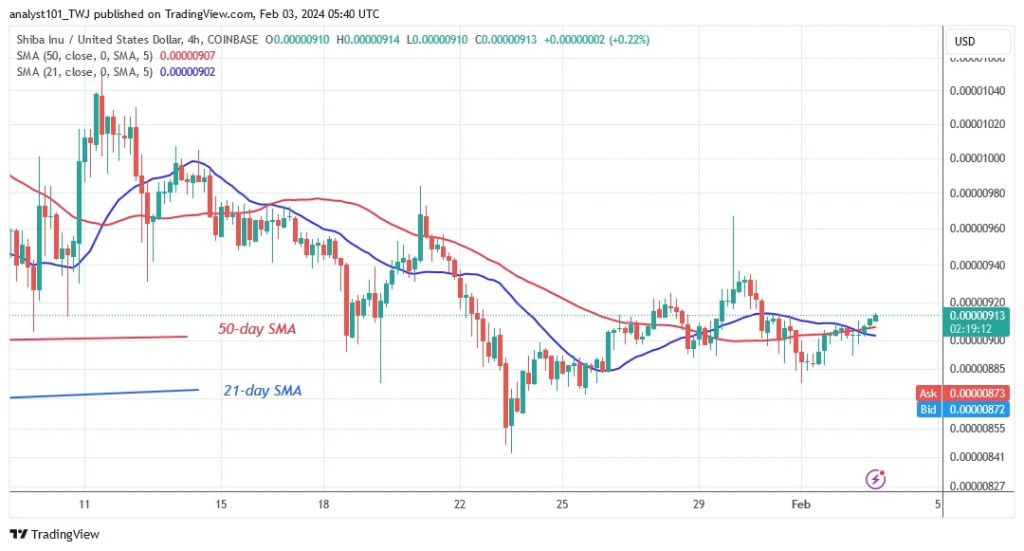
Since the plunge on January 23, the altcoin has been trading below the 21-day moving average lines but above the $0.00000870 support. as reported by Coinidol.com. In an attempt to break the 21-day SMA, the bulls have stepped in. SHIB will rally to the 50-day SMA or a high of $0.00000980 if it breaks above the 21-day SMA.
If the uptrend continues above the 50-day SMA, the altcoin will continue to rise. SHIB will fall back to its previous low of $0.00000833 if it loses its current support. SHIB/USD is now worth $0.00000907.
Analysis of the Shiba Inu indicator
The price bars are below the moving average lines and the 21-day SMA acts as a resistance line to them. The moving average lines are pointing downwards, indicating a negative trend. The Doji candlesticks are consolidating above their current support. This explains the indecision of buyers and sellers.
Technical indicators
Key resistance levels: $0.00001200, $0.00001300, $0.00001400
Important support levels: $0.00000600, $0.00000550, $0.00000450
What is the next move for Shiba Inu?
The downtrend has eased since the altcoin hit a low of $0.00000847 on January 23, 2024. The bulls bought the dips as the altcoin started its uptrend. On January 30, the altcoin climbed to a high of $0.00000967 before plummeting drastically. The long candlestick wick indicates significant selling pressure as prices rise.

Disclaimer. This analysis and forecast are the personal opinions of the author and are not a recommendation to buy or sell cryptocurrency and should not be viewed as an endorsement by CoinIdol.com. Readers should do their research before investing in funds.


