The price of Shiba Inu (SHIB) has risen above the moving average lines. Latest price analysis by Coinidol.com.
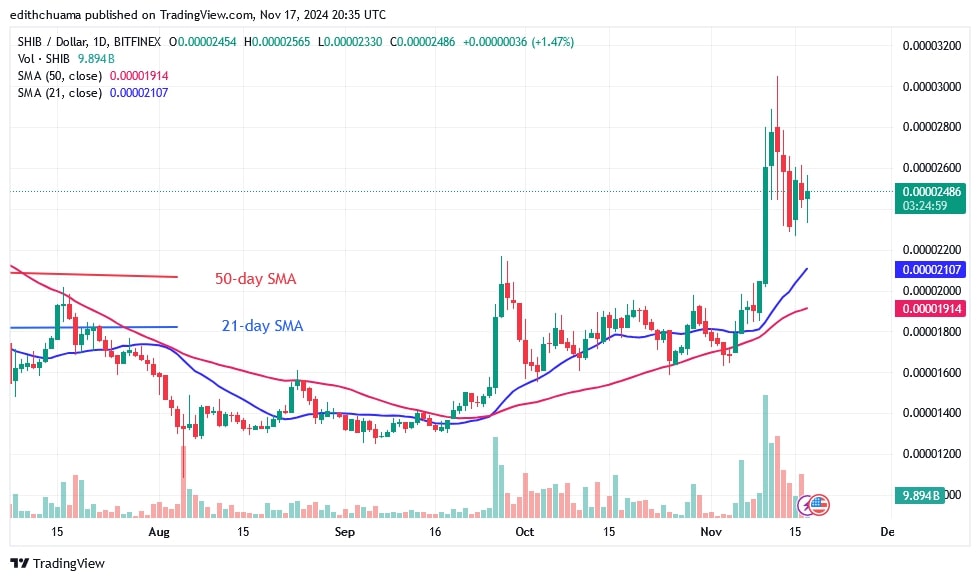
On November 12, the uptrend peaked at $0.00003044 before being beaten back. The altcoin declined and found support above $0.00002300.
SHIB price long-term prediction: bullish
SHIB oscillates above the current support level as it begins its uptrend to the recent high. In other words, the price has been oscillating above the $0.000023 support and below the $0.000028 resistance for the past week. If buyers sustain their bullish momentum above $0.00002800, the altcoin will rise to $0.00003000 and $0.000032000.
Conversely, SHIB price will drop if it falls back below the $0.00002300 support. The altcoin will fall above the 21-day SMA support or the low at $0.00002100.
SHIB indicator analysis
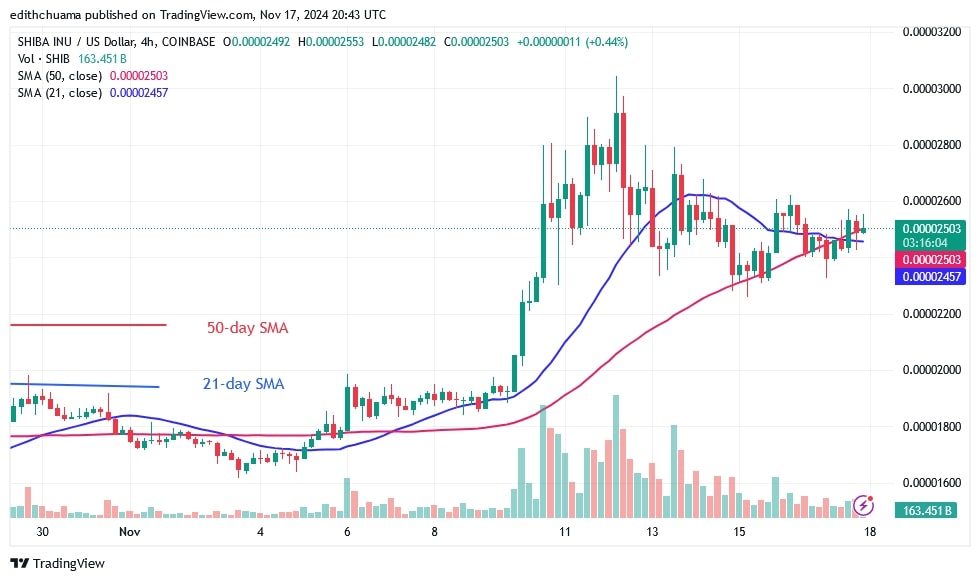
SHIB is trading in the positive trend zone with the price bars declining above the moving average lines. The moving average lines on the 4-hour chart are horizontal, indicating that the cryptocurrency is trending sideways. The price action is steady due to the doji candlesticks.
Technical indicators
Key Resistance levels: $0.00002800, $0.00002900, $0.00003000
Key Support levels: $0.00002200, $0.00002000, $0.00001900
What is the next move for Shiba Inu?
SHIB is moving sideways after finding resistance at $0.00003000 on the 4-hour chart. The price of the cryptocurrency is currently moving in a small range between $0.00002300 and $0.00002600. The formation of Doji candlesticks has caused the price movement to remain stationary.

Coinidol.com reported previously that since its recovery from the bottom of the chart, Shiba Inu coin has been trading above the moving average lines but below the $0.00002200 resistance level.
Disclaimer. This analysis and forecast are the personal opinions of the author. They are not a recommendation to buy or sell cryptocurrency and should not be viewed as an endorsement by CoinIdol.com. Readers should do their research before investing in funds.


