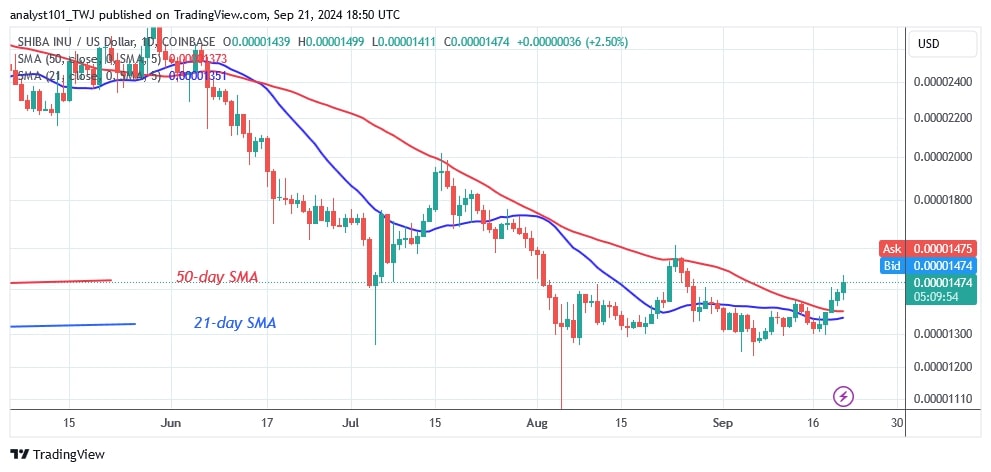
The price of Shiba Inu (SHIB) has rebounded after rising above the moving average lines. SHIB rose above the current support level of $0.00001300 several times as positive momentum returned.
SHIB price Long-term forecast: bullish
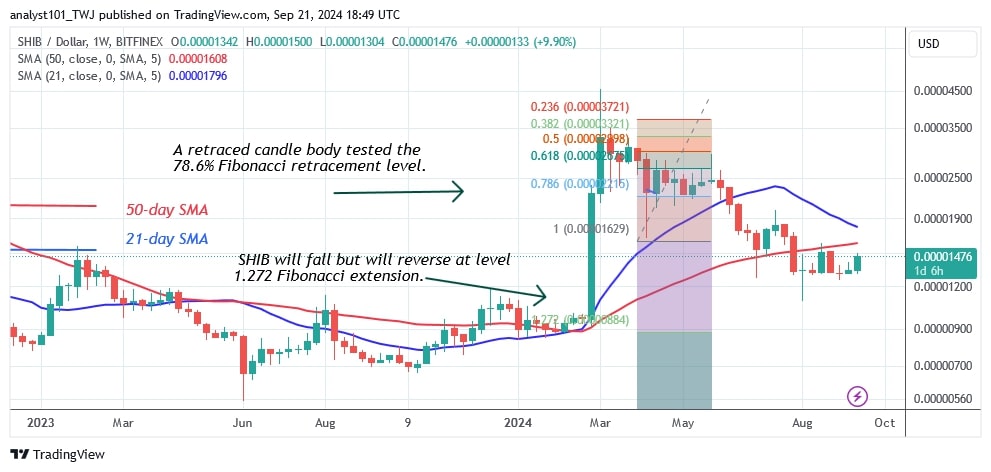
The bullish momentum has always been fended off by the moving average lines and resistance at $0.00001600.
Today, the altcoin is approaching the resistance level of $0.00001600. If the altcoin falls below the current barrier, the price range of $0.00001300 to $0.00001600 remains unchanged. SHIB will rise to a high of $0.00002000 once it overcomes the resistance at $0.00001600.
SHIB indicator analysis
After the recent price rise, the daily chart shows price bars above the moving average lines. Despite breaking above the moving average lines, the cryptocurrency continues to trade within its range. The price action includes doji candlesticks, which reflect traders’ beliefs about the market direction.
Technical indicators
Key Resistance levels: $0.00001200, $0.00001300, $0.00001400
Key Support levels: $0.00000600, $0.00000550, $0.00000450
What is the next move for Shiba Inu?
SHIB has turned around and regained its bullish momentum by rising above the moving average lines. The uptrend is meeting resistance at $0.00001600. The price range will persist if the altcoin falls from its previous high. SHIB will continue to oscillate between the prices of $0.00001300 and $0.00001600.

On September 14, the price of Shiba Inu (SHIB) was trading sideways after the price drop on August 5, as reported by Coinidol.com before.
Disclaimer. This analysis and forecast are the personal opinions of the author. They are not a recommendation to buy or sell cryptocurrency and should not be viewed as an endorsement by CoinIdol.com. Readers should do their research before investing in funds.


