Today, the market continues to stabilize and Ripple coin moved above the $0.48 support level. Price analysis by Coinidol.com.
XRP price long-term forecast: bearish
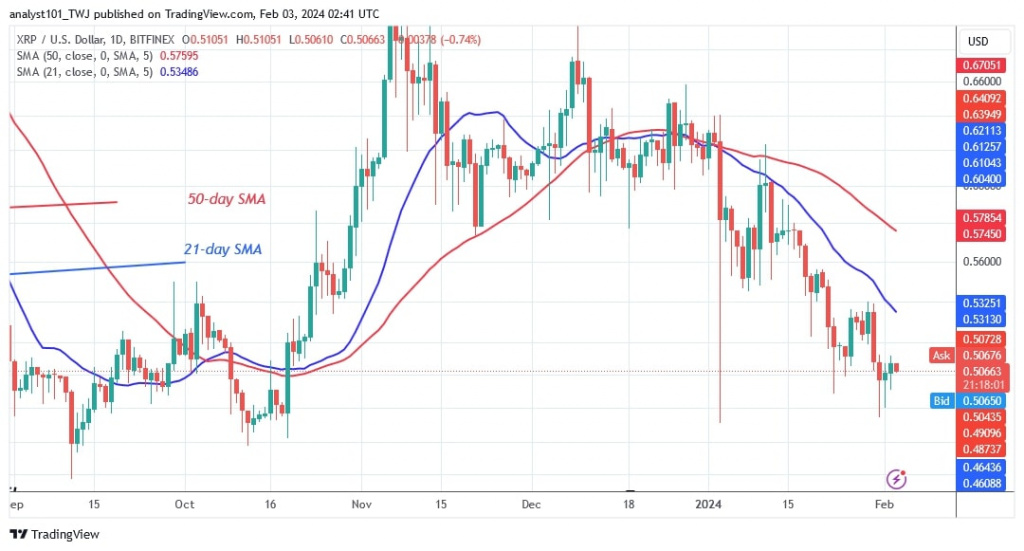
The Ripple (XRP) coin price fell to a low of $0.485 on January 31, 2024. This refers to the price level on January 3, 2024. On January 3, the altcoin quickly fell to a low of $0.48 with the bulls buying the dips.
Ripple coin has reached the bottom of the chart. The altcoin is retesting its historical price from October 12, 2023. On October 12, the altcoin held its historical price level as it entered an uptrend.
Today, XRP has reached the lowest price level again. It has entered the oversold area of the market. On the negative side, further declines in the cryptocurrency seem unlikely. XRP is now worth $0.50.
XRP indicator analysis
The XRP price bars are below the downward sloping moving average lines. The 21-day moving average lines represent resistance for the price bars. The cryptocurrency has reached the bottom of the chart. The tail of the long candle is pointing down, indicating significant buying pressure at the bottom of the chart.
Technical indicators:
Key resistance levels – $0.80 and $1.00
Key support levels – $0.40 and $0.20
What is the next move for XRP?
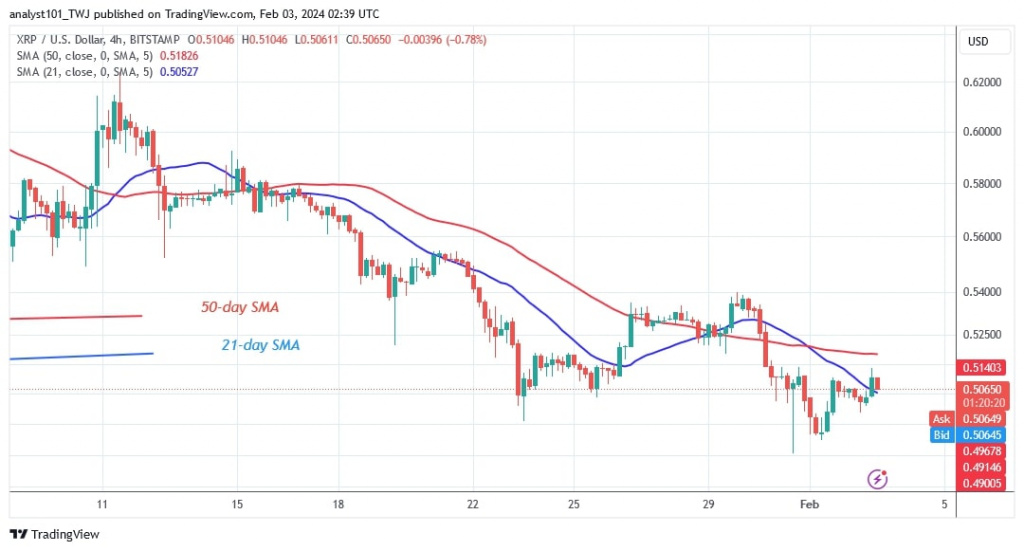
The cryptocurrency has reached the bottom of the chart. On the 4-hour chart, the price of the altcoin is moving between $0.48 and $0.54.
As the market approaches an oversold level, the cryptocurrency is consolidating above the current support. The extended candle tails pointing to the lower part of the chart indicate that the decline is likely to stall.

Disclaimer. This analysis and forecast are the personal opinions of the author and are not a recommendation to buy or sell cryptocurrency and should not be viewed as an endorsement by CoinIdol.com. Readers should do the research before investing in funds.


