The price of Ripple (XRP) has returned to its original range after rejecting the $0.55 resistance area. Cryptocurrency price analysis from Coinidol.com.
Long-term XRP price forecast: Bearish
The price of the cryptocurrency is at $0.51 at the time of writing. The bulls desperately tried to resume the uptrend last week, but were rebuffed.
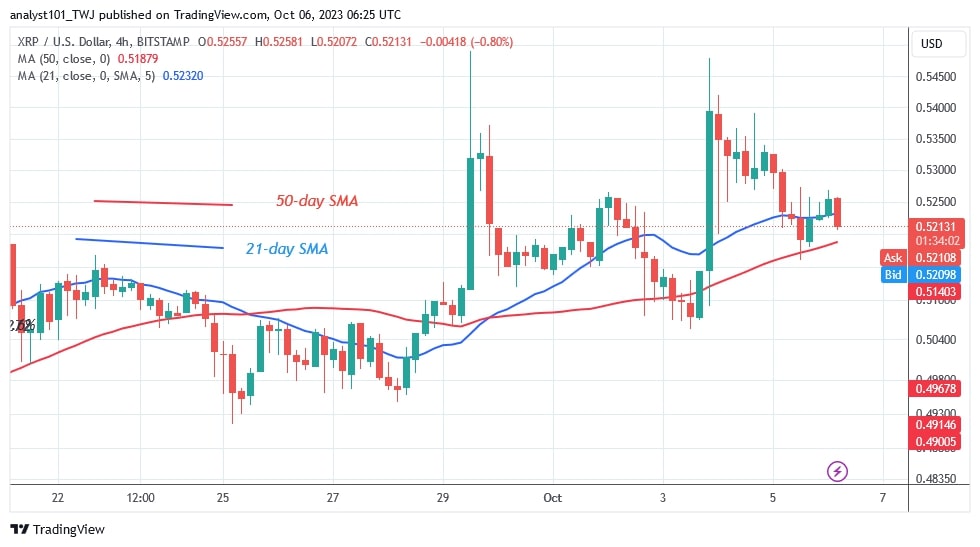
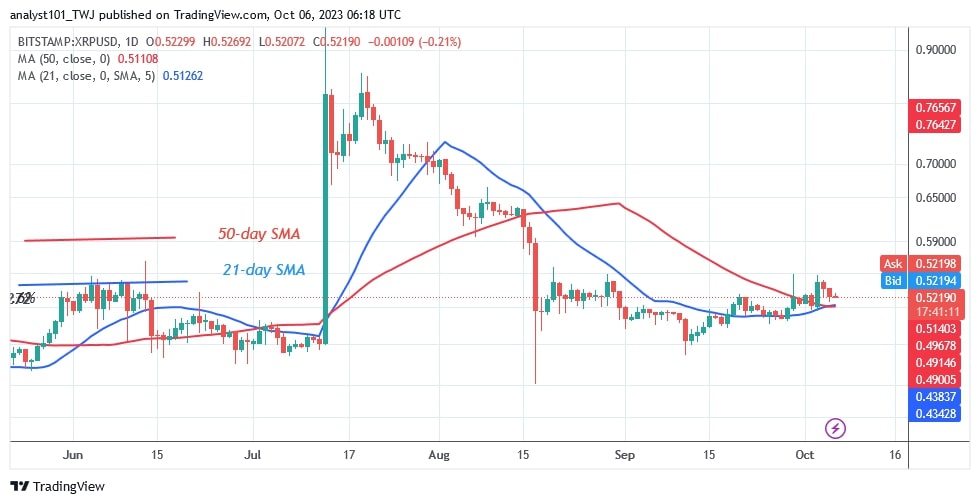
XRP rallied and broke through the moving average twice on September 29 and October 3, but failed to overcome resistance at $0.55. Since August 17, the $0.55 high has held back the upside.
The altcoin will continue its downward movement between $0.45 and $0.55. The upward movement will resume when the decline ends above the moving average lines.
XRP Indicator Analysis
The cryptocurrency’s price bars are now above the moving average lines after a recent rejection. XRP could resume consolidation above the current support as the moving average lines are horizontally flat. The cryptocurrency is trapped between the moving average lines in the shorter time frame. As a result, the altcoin will enter a sideways movement again.
Technical indicators:
Key resistance levels – $0.80 and $1.00
Key support levels – $0.40 and $0.20

What is the next step for XRP?
After the failed attempt to break the above mentioned resistance, the cryptocurrency has started a trend within the trading range. The current retracement could end above the $0.5102 support. Currently, the price of the altcoin fluctuates between $0.45 and $0.55.

Disclaimer. This analysis and forecast are the personal opinions of the author and are not a recommendation to buy or sell cryptocurrency and should not be viewed as an endorsement by CoinIdol.com. Readers should do their research before investing in funds.


