- Bitcoin price trades at $26,443 after reaching a low of $24,825 on June 15.
- The sudden crash prompted whales to take action and scoop BTC at a discount.
- Active stablecoin deposits have also spiked, showing that sidelined buyers are also interested.
Bitcoin price saw a sudden sell-off on April 19 and has been crashing since. The recent spike in bearish momentum pushed BTC down to $24,825, but an uptick in the presence of buyers has simultaneously triggered a recovery rally.
Also read: BlackRock Bitcoin ETF application, making a case for SEC approval
Bitcoin price ready to undo recent losses
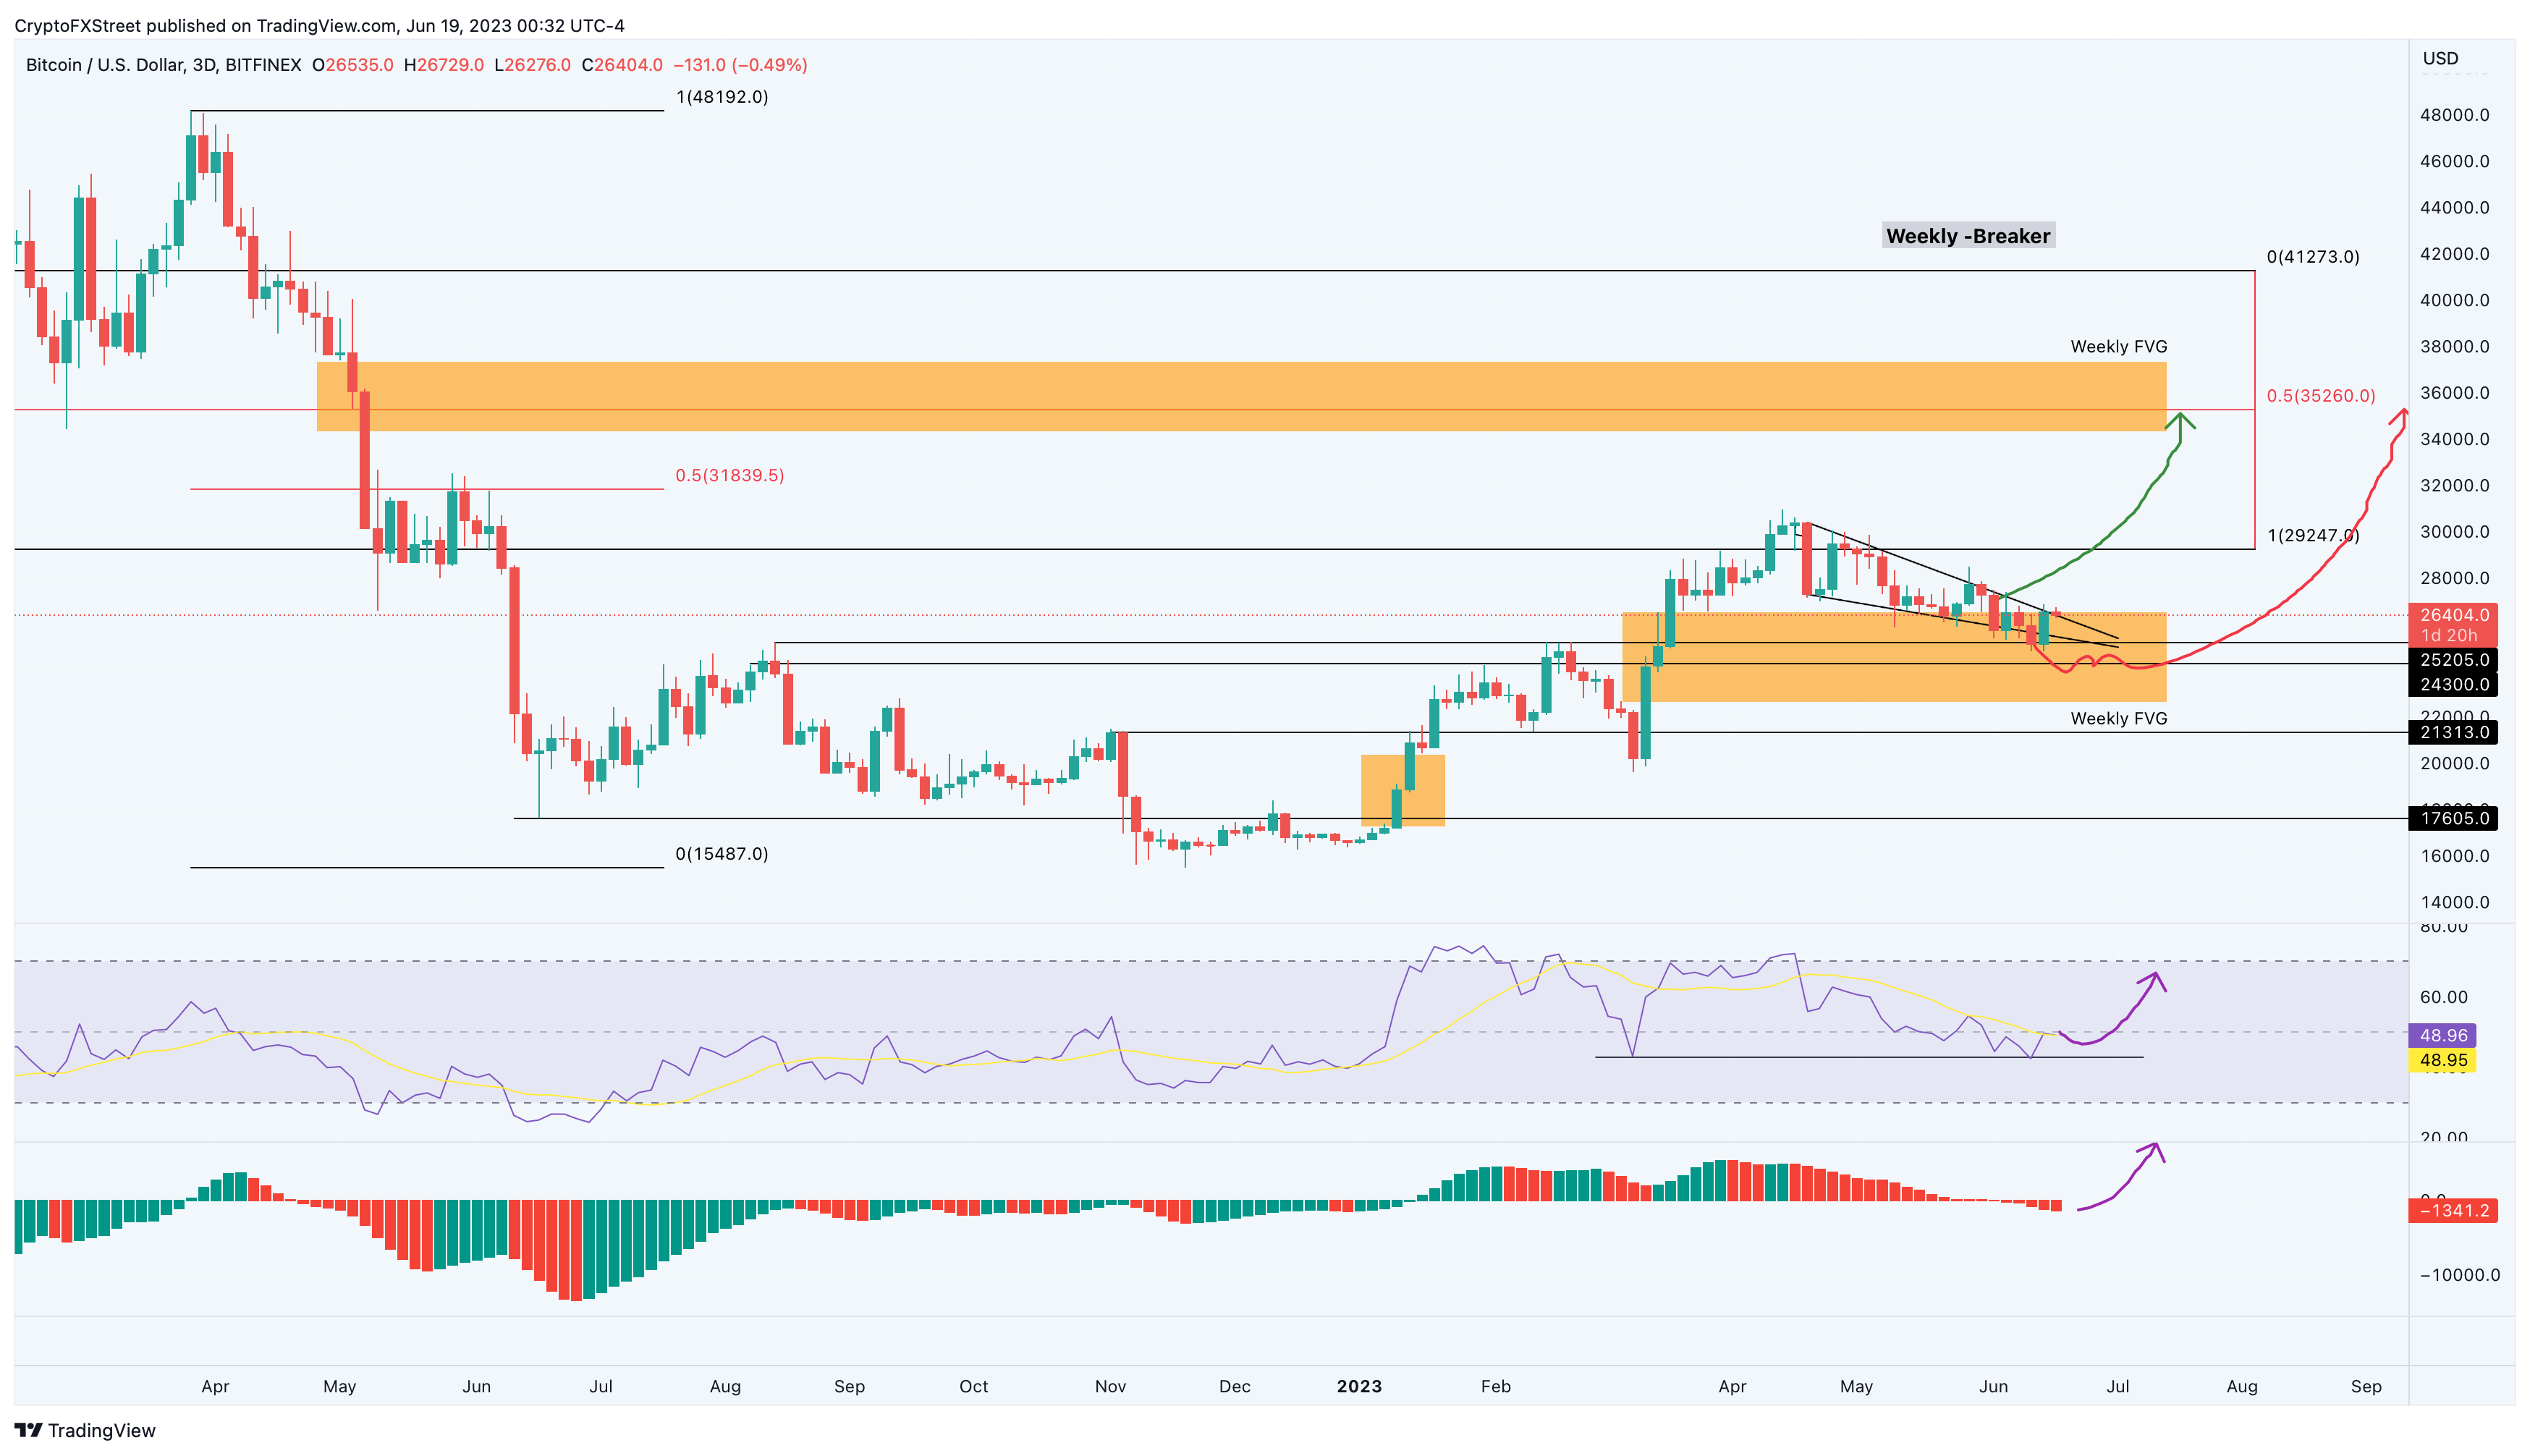
Bitcoin price has dropped from a local top of $30,968 and reached a potential local bottom at $24,825 on June 15. Since then, BTC has shot up 8% and currently trades at $26,452. The chart below shows that the Relative Strength Index (RSI) has produced equal lows while BTC has set up higher lows.
This development in the momentum indicator does not signify a recovery rally in store. Additionally, the Awesome Oscillator also needs to flip above the zero line to signal a resurgence of bullish momentum.
However, should Bitcoin price kickstart a recovery bounce, the targets include the weekly Bearish Breaker extending from $29,247 to $41,273. The midpoint of this setup at $35,260 is also a key take-profit level for buyers.
For more information about bearish breakers, read this: Where will the 2023 crypto bull rally top? – ICT
BTC/USDT 3-day chart
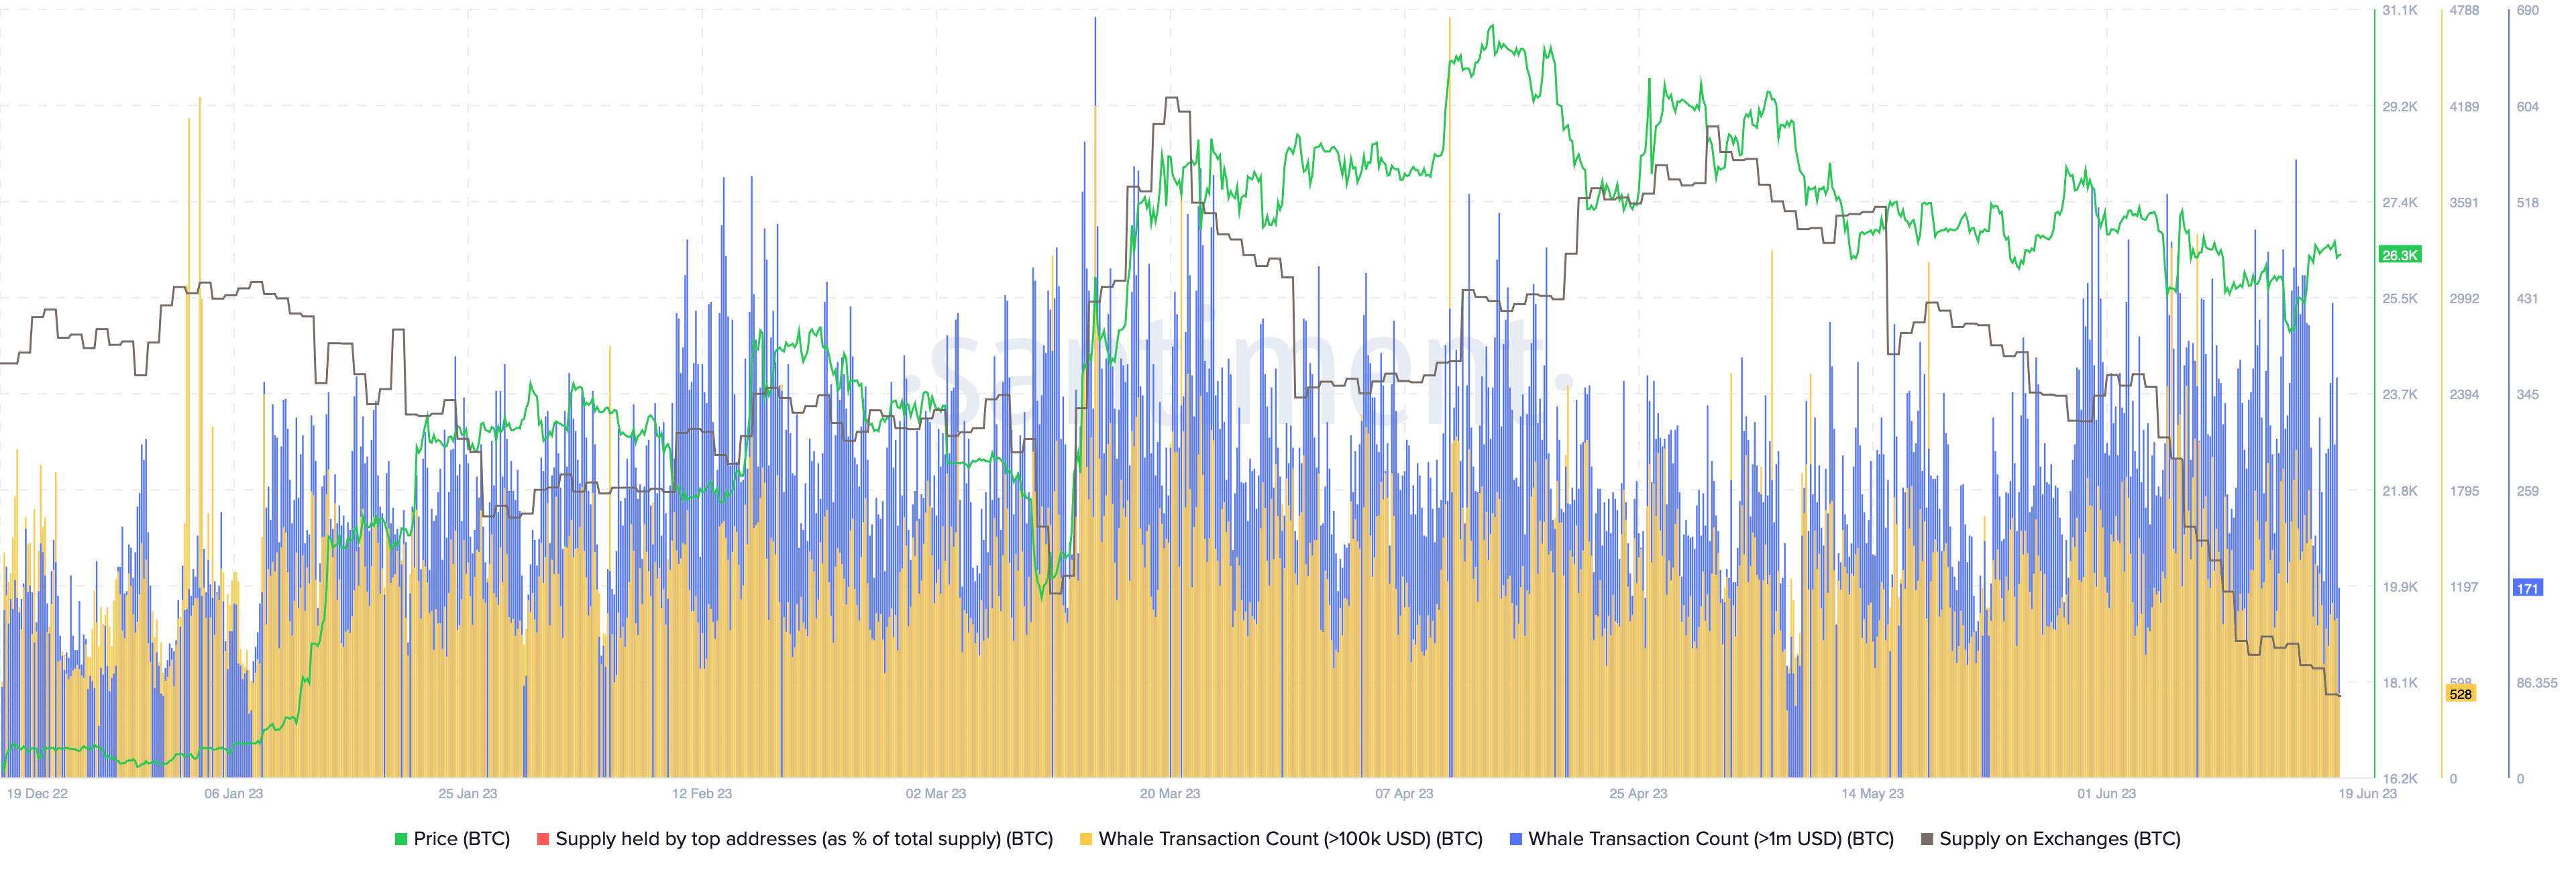
Supporting this rally for Bitcoin price is the Whale Transaction count, which tracks transactions worth $100,000 or more. As seen in the chart below, the yellow lines represent transfers worth $100,000 or more, and the blue lines represent transactions worth $1,000,000 or more.
As illustrated, the blue lines have seen a considerable increase on June 15, when BTC slid below the $25,000 psychological level, signaling a potential transfer to accumulate.
BTC Whale Transaction chart
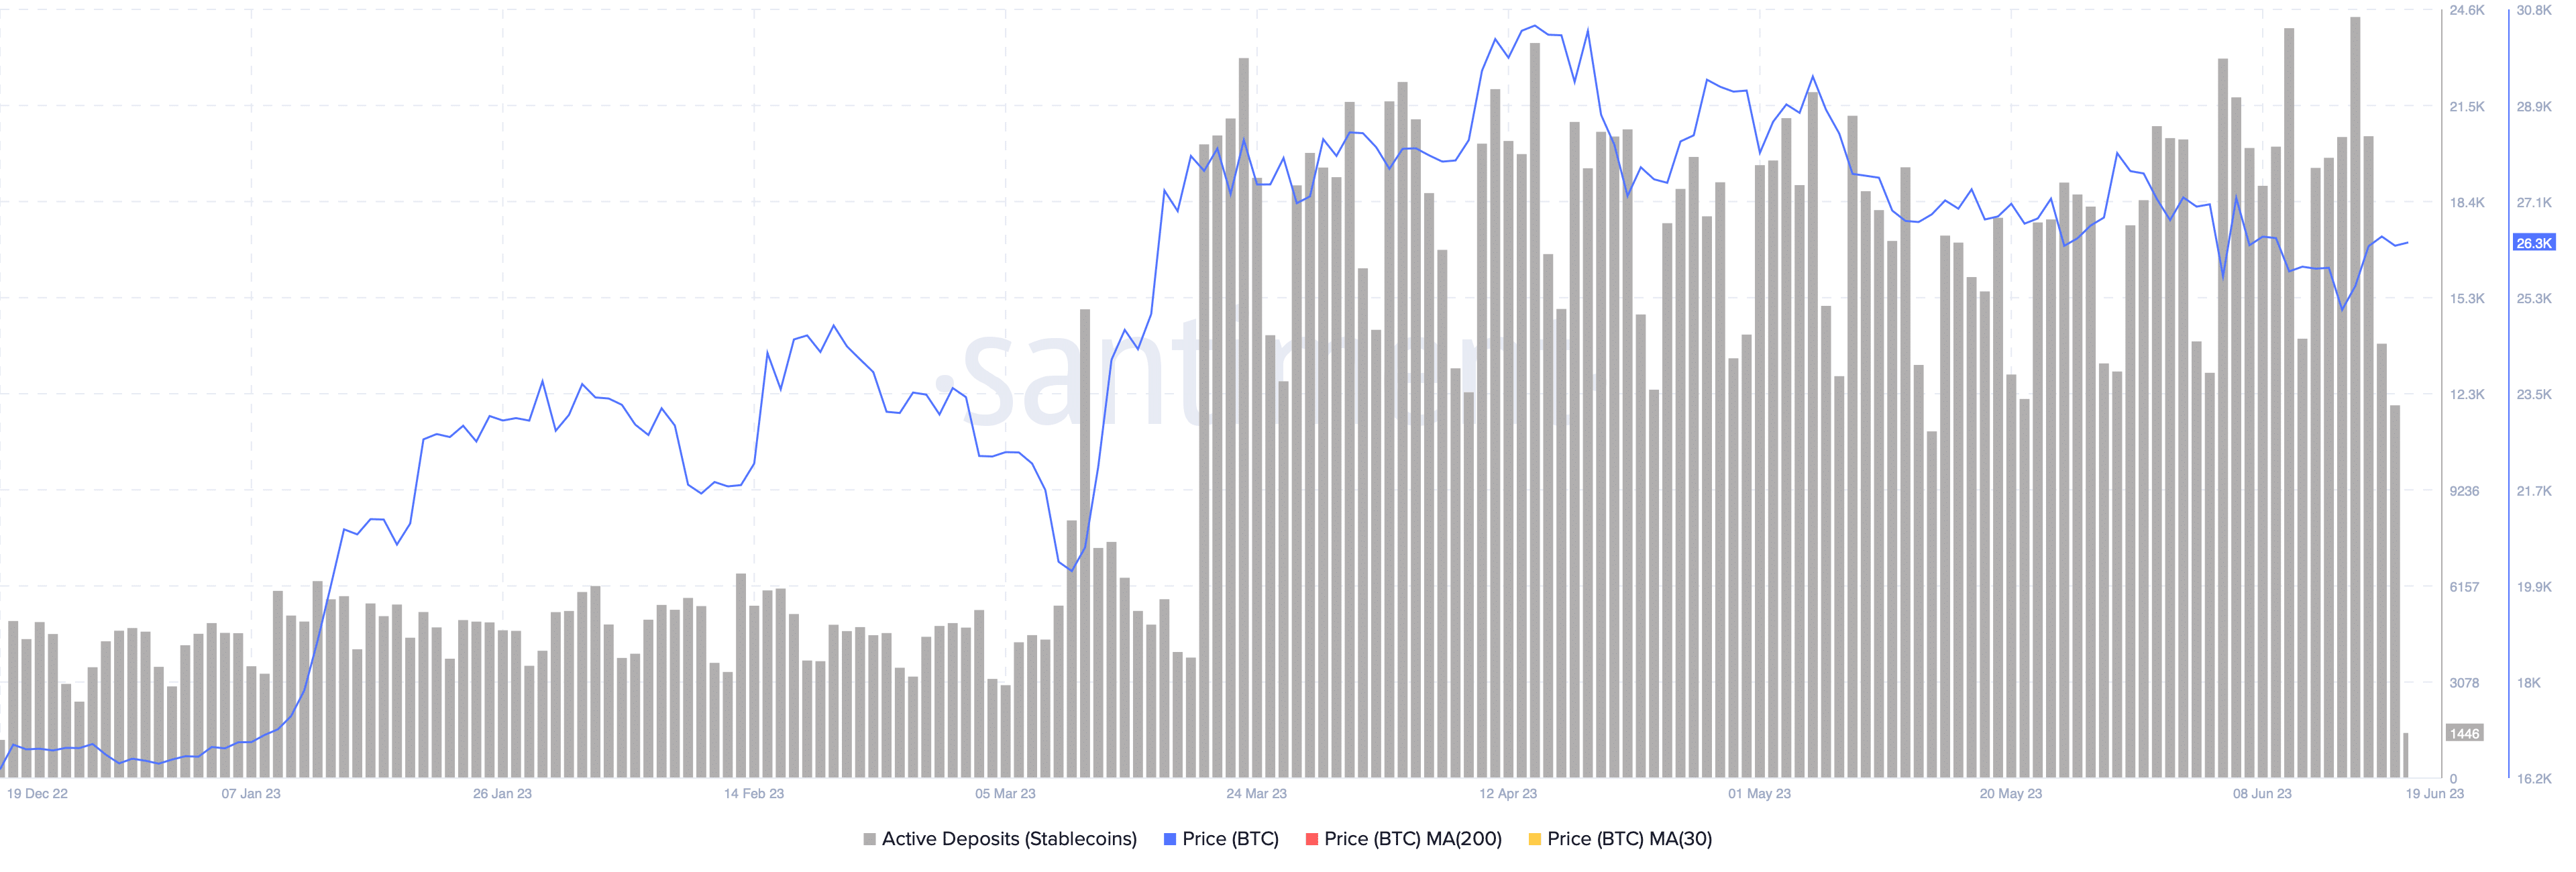
Likewise, the Active Stable Deposit chart has also seen a considerable uptick since May 18, but has picked up steam after May 5. These transactions spiked from roughly 14,000 to 24,300, representing a 73.50% surge.
All of the data points to an active accumulation of BTC or preparation to accumulate should the Bitcoin price slide lower. Keeping that in mind, a retest of $24,300 to cull early bulls is possible and investors should not be surprised if this scenario occurs.
BTC Active Stablecoin Deposits
However, if Bitcoin price flips the $24,000 level into a resistance level and fails to recover, it will invalidate the bullish thesis. Such a development could potentially trigger a steep correction to the next stable support floor at roughly $21,300.


