Quant (QNT) price is regaining upward momentum after rising above the moving average lines.
Quant long-term price forecast: bullish
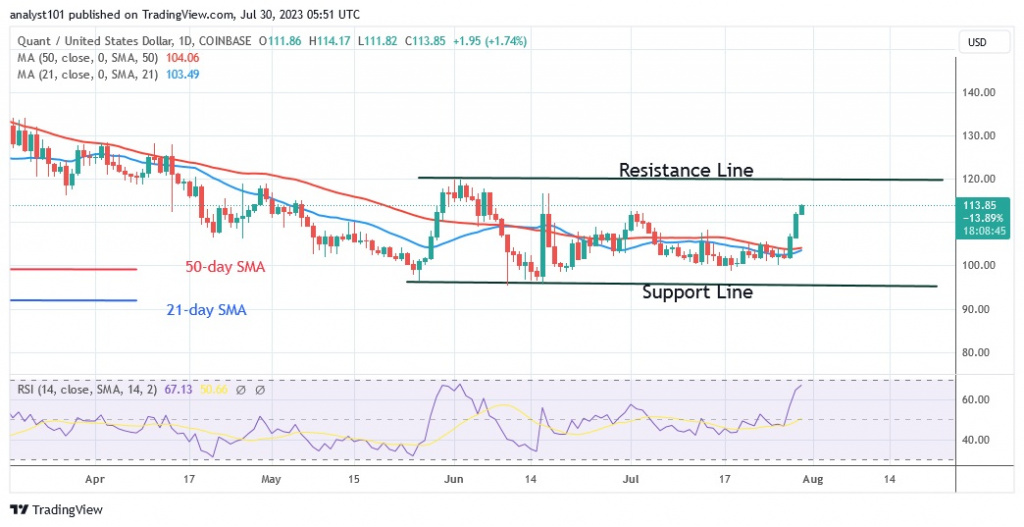
Earlier, the cryptocurrency asset recovered from its previous downturn and resumed a sideways pattern. The price of QNT fluctuated between $96 and $120. Buyers made two unsuccessful attempts to break the barrier at $120.
Today, QNT is rising and reached a high of $112.83. The price of the cryptocurrency is rising as it prepares to test the barrier for the third time. On the positive side, the $120 resistance level has not been breached since May 30. If buyers keep the price above the $120 resistance, the market will rise to highs of $150 and $160. On the other hand, the current movement between $96 and $120 will continue if the price is rejected at the recent high.
Quant price indicator analysis
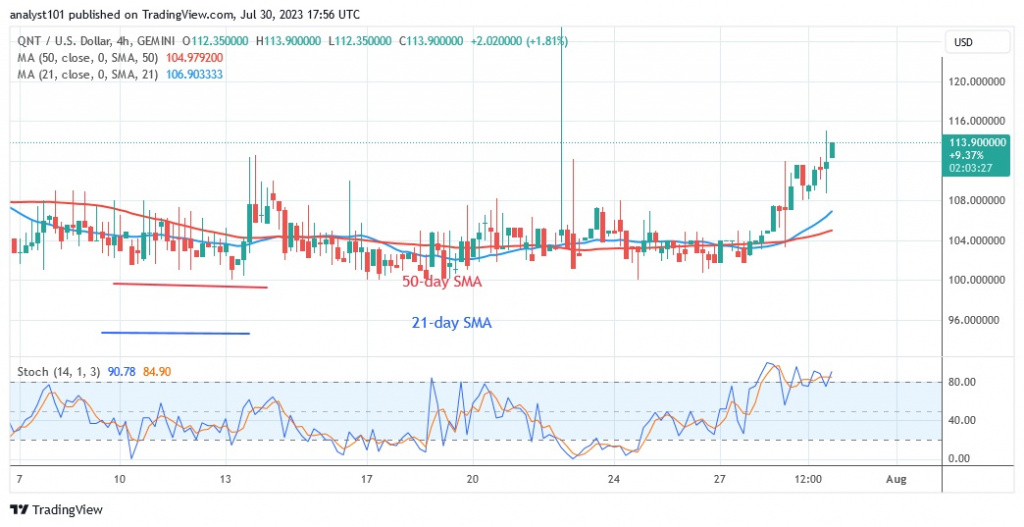
QNT is in an uptrend and approaching the Relative Strength Index of period 14 of level 65 and the market is approaching an overbought condition. The price bars are currently above the moving average lines while the cryptocurrency is approaching the overbought zone. QNT is above the daily stochastic threshold of 80. The altcoin is already in the overbought zone of the market.

Technical Indicators
Key supply zones: $140, $150, $160
Key demand zones: $90, $80, $70
What is the next move for Quant?
QNT is rising as the market reaches the overbought zone. The cryptocurrency is trying to retest the high of $114. In the past, the altcoin was bounced twice from the recent high. If the bulls fail to break the current high, the movement between the moving average lines will continue.

Disclaimer. This analysis and forecast are the personal opinions of the author and are not a recommendation to buy or sell cryptocurrency and should not be viewed as an endorsement by CoinIdol.com. Readers should do their own research before investing in funds.


