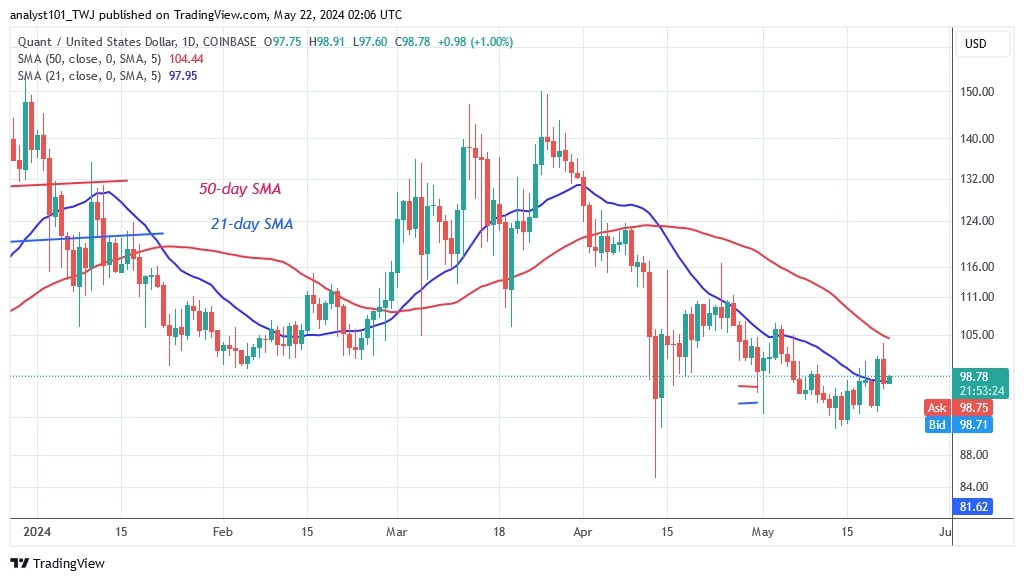
The price of Quant (QNT) remained above the support at $91.50 but below the moving average lines.
Long-term forecast for the Quant price: range
Quant price is also tied to the moving average lines. The sideways trend has continued as buyers have not been able to sustain the price above the 50-day SMA despite it breaking above the 21-day SMA.
On the upside, the market will reach its first target at $125 if the buyers break the resistance at $105 or the 50-day SMA. Currently, QNT is trading above the 21-day SMA support or the low of $98.97. However, if the altcoin loses its current support, QNT will retrace to its previous low of $91.50.
Analysis of the quant price indicator
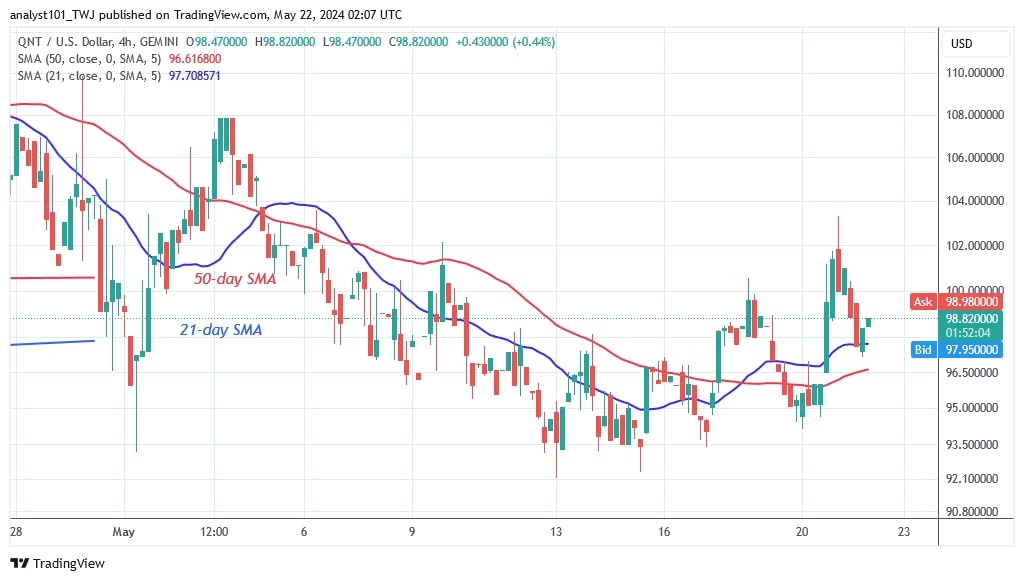
On May 20, the altcoin rallied, causing the price to rise and stay between the moving averages. QNT is set to rise as the price bars on the 4-hour chart are above the moving average lines. QNT is also trading within a limited range of $91.50 and below $105.
Technical Indicators
Key supply zones: $140, $150, $160
Key demand zones: $90, $80, $70
What is Quant’s next move?
Quant is currently trading in a range, with the upside limited by the 50-day SMA or resistance at $105. The 21-day SMA is near the price bars, with the altcoin trading between $91.50 and $105. There is a prospect of a breakout or breakout.
Coinidol.com reported on May 15 that QNT was in a downtrend and reached a low of $94.

Disclaimer. This analysis and forecast are the personal opinions of the author and are not a recommendation to buy or sell cryptocurrency and should not be viewed as an endorsement by CoinIdol.com. Readers should do their research before investing in funds.


