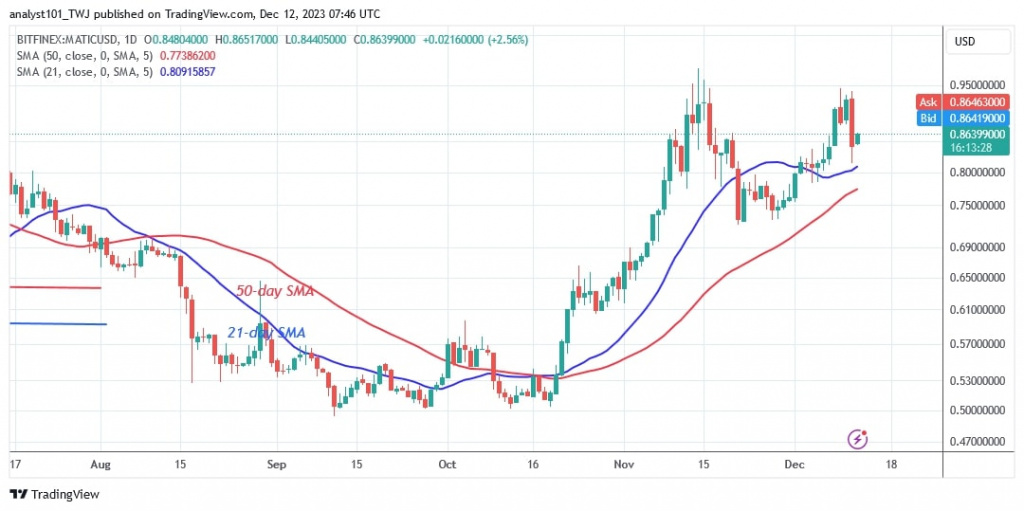
The price of Polygon (MATIC) is stuck at $0.95. The recent high has fended off the upward correction twice.
Polygon price long term prediction: ranging
The cryptocurrency has recovered from its previous decline, but the uptrend came to an end on November 14. Polygon was forced into a sideways trend by the end of the uptrend. The price of the altcoin is currently fluctuating between $0.75 and $0.95. Buyers could push the price to a high of $1.20 if they break through the $0.95 level. If the bears breach the current support at $0.75 and the downward momentum continues, MATIC will fall and revisit the previous low at $0.50. At the time of writing, the altcoin is trading at $0.86.
Polygon indicator analysis
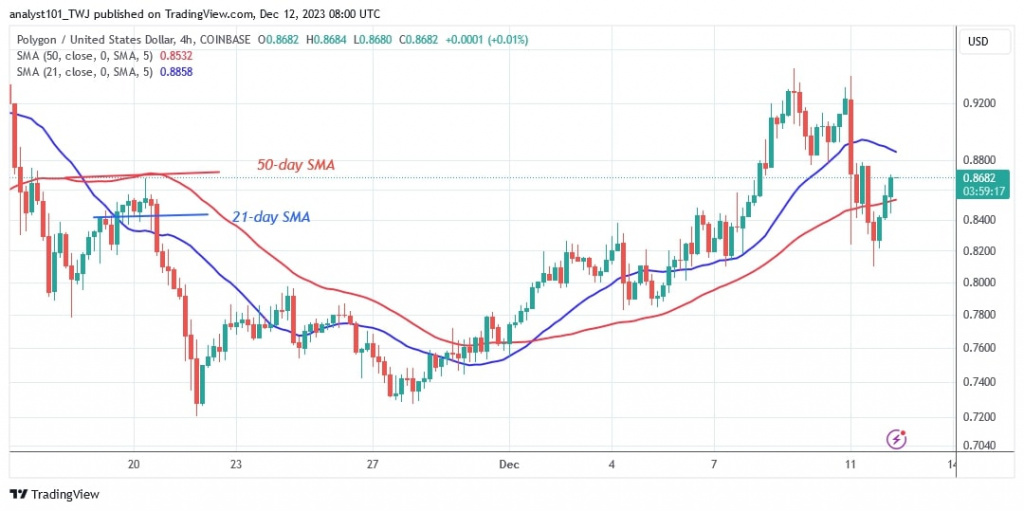
The price of the cryptocurrency is trading between the moving average lines on the 4-hour chart. This indicates that the cryptocurrency will continue to trend sideways. The moving average lines are sloping upwards, indicating an upward correction. A retest of the overhead resistance is likely as long as the price remains above the moving average lines.
Technical indicators
Resistance levels: $1.20, $1.30, $1.40
Support levels: $0.60, $0.40, $0.30
What is the next move for Polygon?
Polygon has recovered from its previous downturn, even if the uptrend was short-lived. If buyers break through the current resistance level, the cryptocurrency will resume its uptrend. Buyers may weaken or break through the current resistance level if it is retested frequently. In the meantime, the sideways trend will continue.

Disclaimer. This analysis and forecast are the personal opinions of the author and are not a recommendation to buy or sell cryptocurrency and should not be viewed as an endorsement by CoinIdol.com. Readers should do their research before investing in funds.


