The price of Polygon (MATIC) is declining and is currently below the moving average lines.
Long-term forecast of the Polygon price: bearish
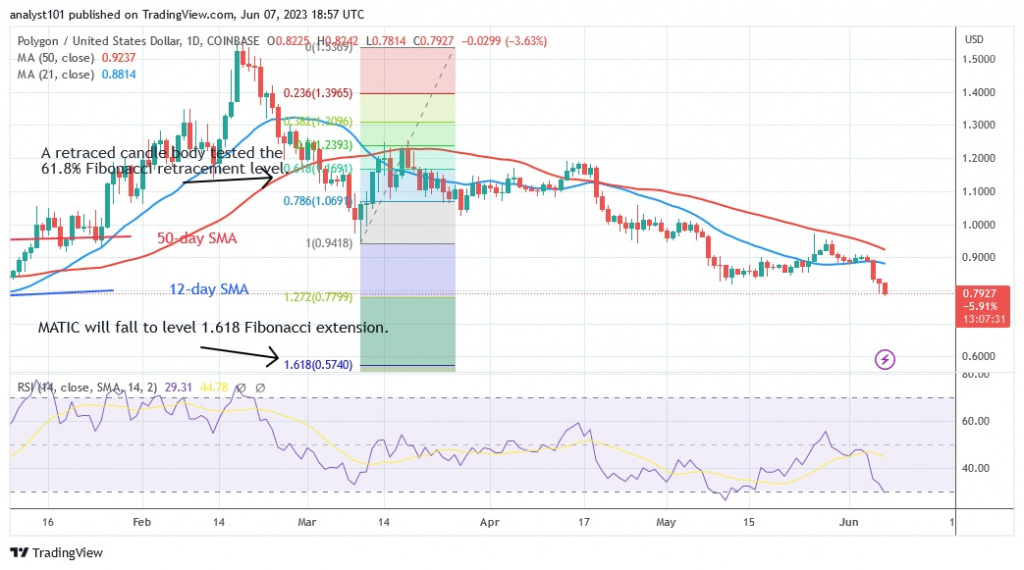
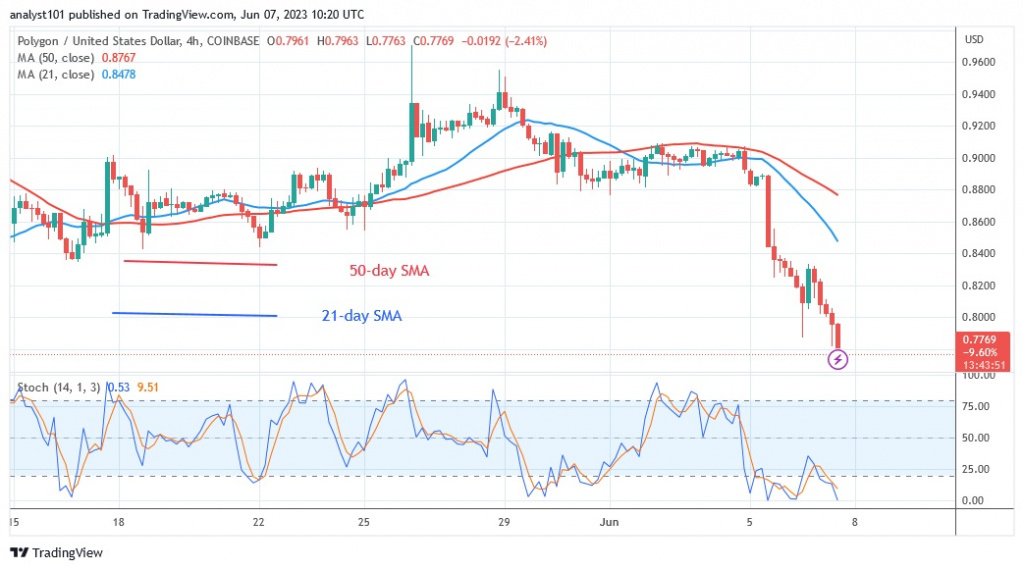
The negative trend of the altcoin has continued by reaching the support level, which is currently at 0.82. The price signal indicates that Polygon will continue to decline. During the decline that started on March 10, Polygon delivered an upward correction and a candlestick tested the 61.8% Fibonacci retracement level. The change will cause MATIC to fall below the Fibonacci level of 1.618 or $0.57. Based on market movement, the cryptocurrency has fallen to a low of $0.77 at the time of writing.
Polygon indicator analysis
The Relative Strength Index for period 14 has the cryptocurrency at level 29. The oversold area of the market has been reached by the current decline. The decline is due to the price bars being below the moving average lines. The daily stochastic indicates that the MATIC is oversold as it is below the level of 20.

Technical indicators
Resistance levels: $1.20, $1.30, $1.40
Support levels: $0.60, $0.40, $0.30
What is the next move for Polygon?
Polygon is in a downtrend and is approaching the low of $0.57. However, the current decline has reached the oversold area. Selling pressure will undoubtedly ease as the market tires of the gloomy sentiment. In the meantime, Polygon price has fallen to its historic low of December 30, 2022.

Disclaimer. This analysis and forecast are the personal opinions of the author and are not a recommendation to buy or sell cryptocurrency and should not be viewed as an endorsement by CoinIdol. Readers should do their own research before investing in funds.


