The price of Polygon (MATIC) is in a downtrend, but is correcting upwards. Price analysis by Coinidol.com.
Long-term forecast for the Polygon price: bearish
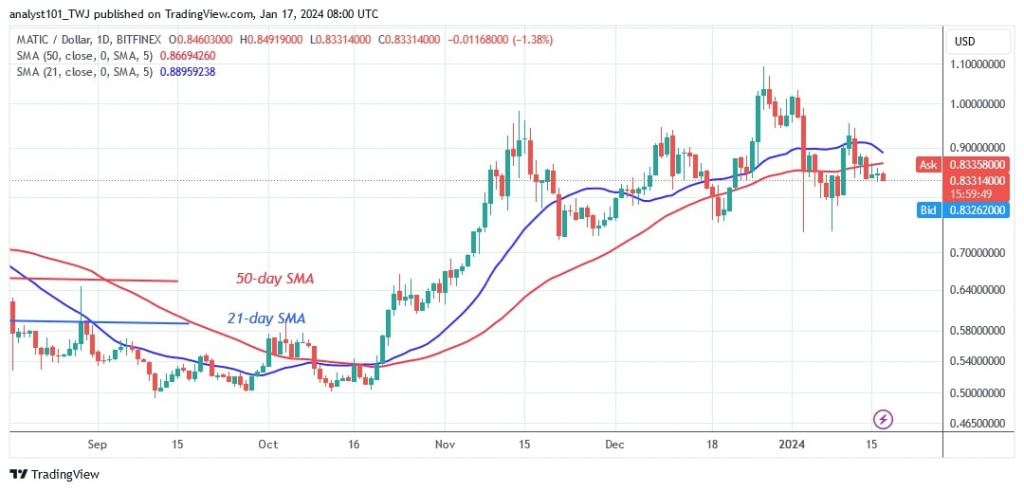
The rising correction stopped on November 14, 2023 and ended in a sideways trend below the $0.95 resistance level.
On January 11, 2024, buyers tried to push the cryptocurrency to the $95 resistance level but were rebuffed for the fourth time. Polygon has dropped today and is currently trading at $0.83. The altcoin is in a bearish trend zone, making an upward push unlikely.
In the negative case, the market will continue to fall and reach the next support level of around $0.75. The current support level of $0.75 has not been breached since November 21, 2023. In addition, the long candlestick tails indicate significant buying pressure at $0.75.
Analysis of the Polygon indicator
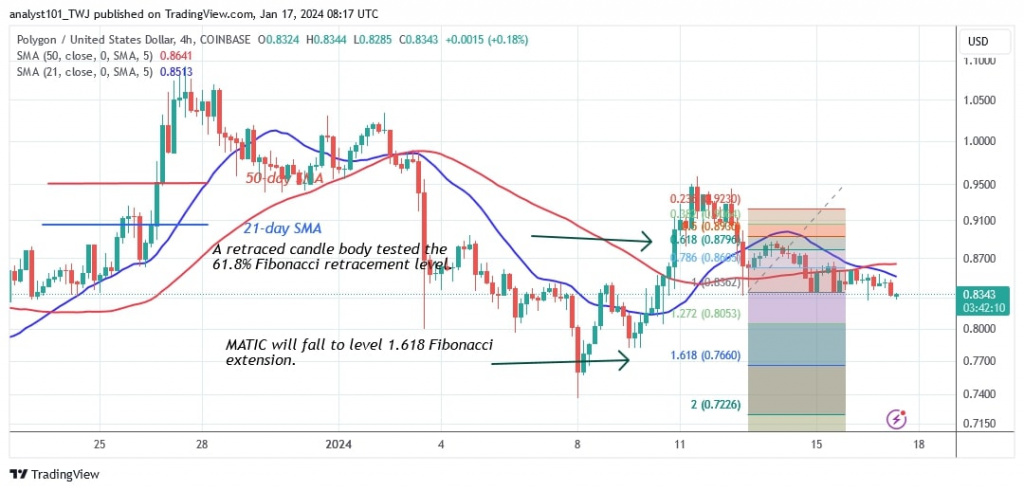
Polygon’s price bars are below the moving average lines, indicating that the altcoin was rejected at its high of $0.95. The current price bars below the moving average will accelerate the coin’s descent. On the 4-hour chart, the moving average lines are sloping downwards, indicating a decline.
Technical indicators
Resistance levels: $1.20, $1.30, $1.40
Support levels: $0.60, $0.40, $0.30
What’s next for Polygon?
The price of Polygon is falling below the moving average lines. According to the price prediction, Polygon will fall to the 1.618 Fibonacci extension or the low of $0.76. Based on the price activity, the altcoin has dropped to a low of $0.83. The cryptocurrency will find support and return above the $0.75 level.
A week ago Coinidol.com reported that MATIC saw a significant drop to a low of $0.73 on January 3 before rebounding.

Disclaimer. This analysis and forecast are the personal opinions of the author and are not a recommendation to buy or sell cryptocurrency and should not be viewed as an endorsement by CoinIdol.com. Readers should do the research before investing in funds.


