Polygon’s (MATIC) decline has persisted above the $0.63 support while remaining below the moving average lines. Price analysis by Coinidol.com.
Long-term Polygon price prediction: bearish
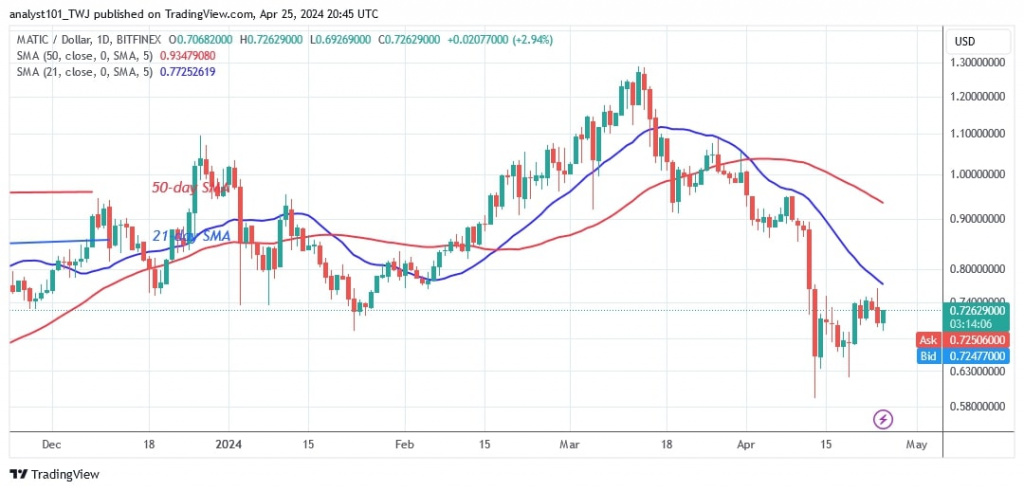
The cryptocurrency recovered from its previous downtrend before posting another decline. MATIC rose to $1.28 before falling again. Polygon fell to a low of $0.59 before recovering. Selling pressure has eased as the bulls have halted the decline above the $0.63 support.
Polygon is currently in a sideways trend above the $0.63 support. MATIC is trading above the $0.63 support but below the moving average lines or resistance at $0.76. The altcoin has been fluctuating within its range over the past week.
On the upside, Polygon will resume a positive trend if buyers keep the price above the moving average lines. MATIC will drop to $0.49 if the current support is broken.
Analyzing the Polygon indicator
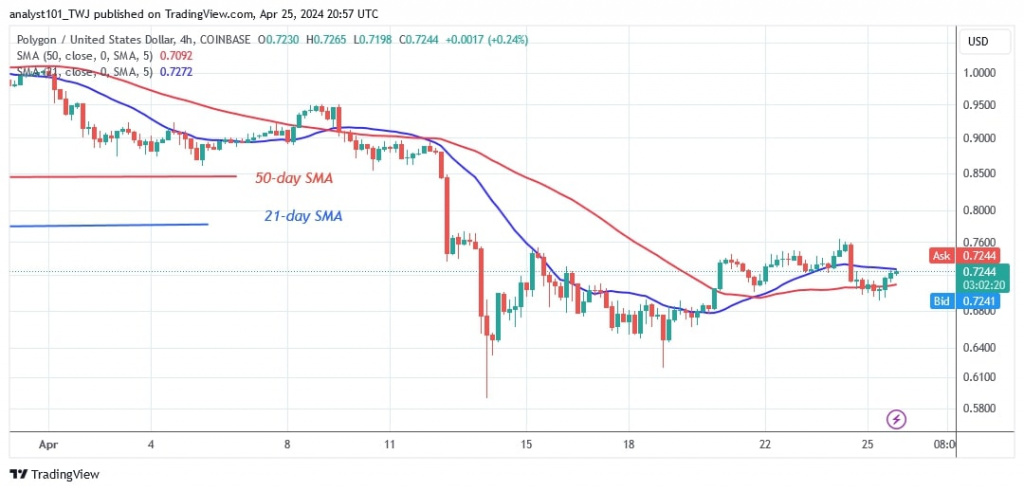
The selling pressure has eased and the price bars are still below the moving average lines. On the 4-hour chart, the price bars are between the moving average lines. This suggests that the polygon indicator may be moving within a range. Doji candlesticks mark the price movements.
Technical indicators
Resistance levels: $1.20, $1.30, $1.40
Support levels: $0.60, $0.40, $0.30
What is the next step for Polygon?
Polygon is currently trading in a limited range of $0.63 to $0.76. The doji candlesticks have further restricted the price movement. The altcoin is trading modestly due to trader hesitation. The cryptocurrency will drop to the bottom of the charts if it loses its current support level.

Disclaimer. This analysis and forecast are the personal opinions of the author and are not a recommendation to buy or sell cryptocurrency and should not be viewed as an endorsement by CoinIdol.com. Readers should do their research before investing in funds.


