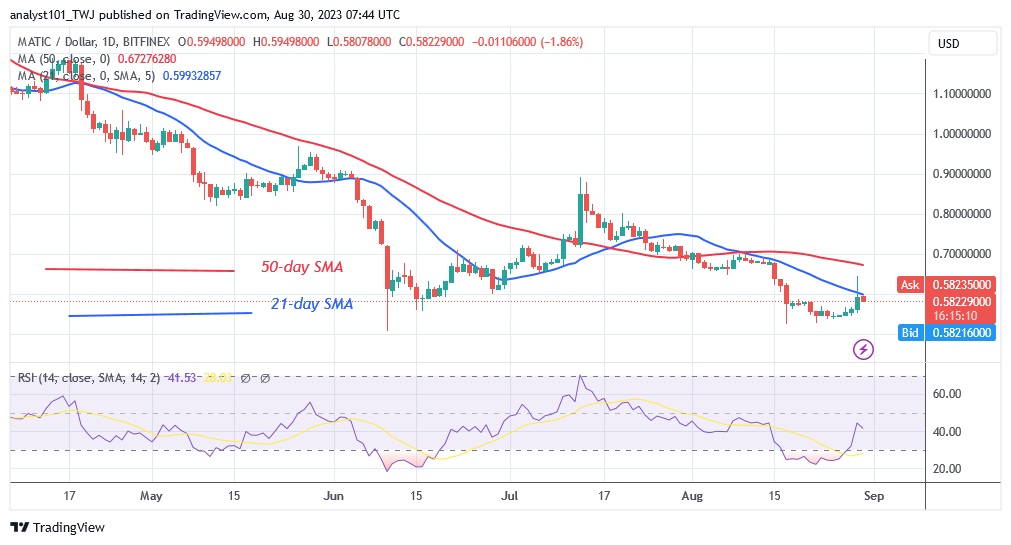
Cryptocurrency analysts of Coinidol.com report, Polygon (MATIC) price has been rising but is encountering resistance at the $0.65 high or the 21-day line SMA.
Long-term forecast of the Polygon price: bearish
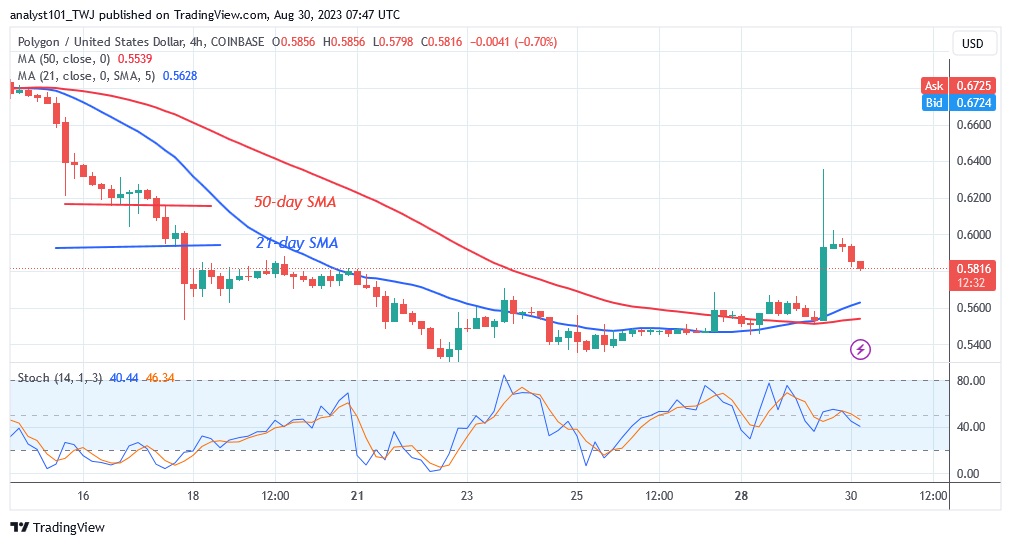
The upward momentum was rejected on August 29 at a high of $0.65. The altcoin has fallen below the support level of $0.60. The current support level of $0.60 held in the previous price action. If the bulls fail to regain the previous support at $0.60 or the 21-day line SMA, MATIC will fall and regain the previous low of $0.50. In other words, if the bulls break above the moving average lines, the altcoin will rise. The uptrend will continue to the high of $0.85. Polygon has fallen to a low of $0.58 at the time of writing.
Polygon indicator analysis
Polygon is trading with a Relative Strength Index of 14 level 44. MATIC is bearish as it is in a negative trend. The price bars are below and rejected by the moving average lines, indicating that the price will continue to fall. The altcoin is gaining momentum above the daily stochastic threshold of 40.

Technical Indicators
Resistance levels: $1.20, $1.30, $1.40
Support levels: $0.60, $0.40, $0.30
What is the next step for Polygon?
The crypto asset is declining as its upward movement is slowed down by the moving average lines. The altcoin is falling as it approaches the previous low of $0.50. If the previous price low holds, the cryptocurrency asset will continue to move in a range between $0.50 and $0.60.

As we reported on August 23, the price of the cryptocurrency has held above the support level of $0.52 for the last week. Incidentally, this is the historical price level from June 10.
Disclaimer. This analysis and forecast are the personal opinions of the author and are not a recommendation to buy or sell cryptocurrency and should not be viewed as an endorsement by CoinIdol.com. Readers should do their research before investing in funds.


