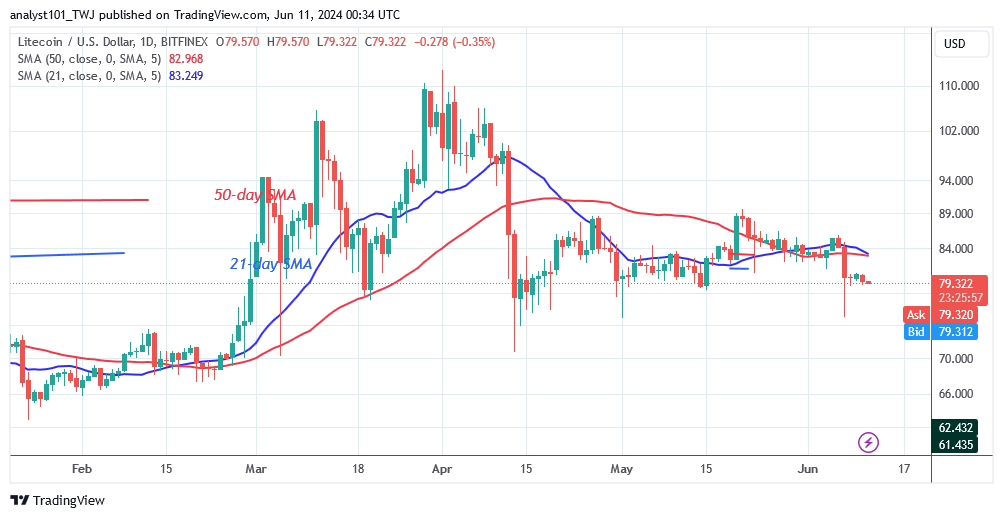
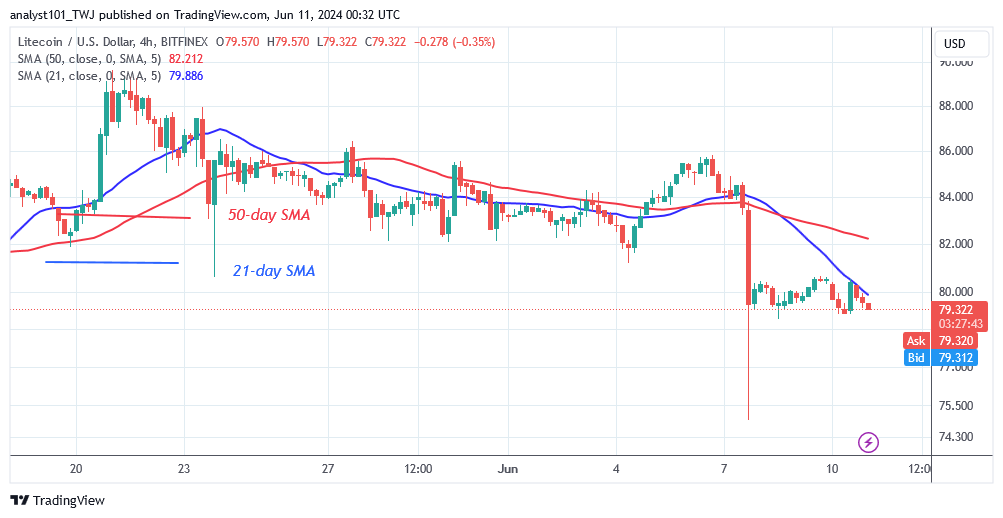
Cryptocurrency analysts of Coinidol.com report, the price of Litecoin (LTC) has fallen below the moving average lines after the price drop on June 7.
Long-term prediction of the Litecoin price: in range
Since May 20, the price of the cryptocurrency has barely traded above the moving average lines. The uptrend was hindered by resistance at $89. On June 7, the cryptocurrency fell well below its moving average lines. The cryptocurrency reached a low of $75 before falling back. The price of LTC has fallen to a range of $73 to $89 per coin. If the current support is breached, the downtrend will continue to the $70 mark. Meanwhile, Litecoin is worth $75 at the time of writing.
Analysis of the Litecoin indicators
Following the current price drop, LTC’s price bars have fallen below the moving average lines. A bearish crossover can be seen on the four-hour and daily charts. If the 21-day SMA falls below the 50-day SMA, this is a sell signal. The moving average lines have dipped downwards in a sideways trend.

Technical indicators
Resistance levels: $100, $120, $140
Support levels: $60, $40, $20
What is the next move for Litecoin?
Litecoin is in a nosedive and is approaching the current support level of $75. The altcoin had already fallen sharply to a low of $75 on June 7, but the bulls bought the dips on the 4-hour chart. The upside correction was denied again at $80. The cryptocurrency value has fallen again and is currently hovering around the $75 support.

Last week Coinidol.com reported that the altcoin fell to a low of $81 before recovering. The price of the cryptocurrency has been moving between the moving average lines.
Disclaimer. This analysis and forecast are the personal opinions of the author and are not a recommendation to buy or sell cryptocurrency and should not be viewed as an endorsement by CoinIdol.com. Readers should do their research before investing in funds.


