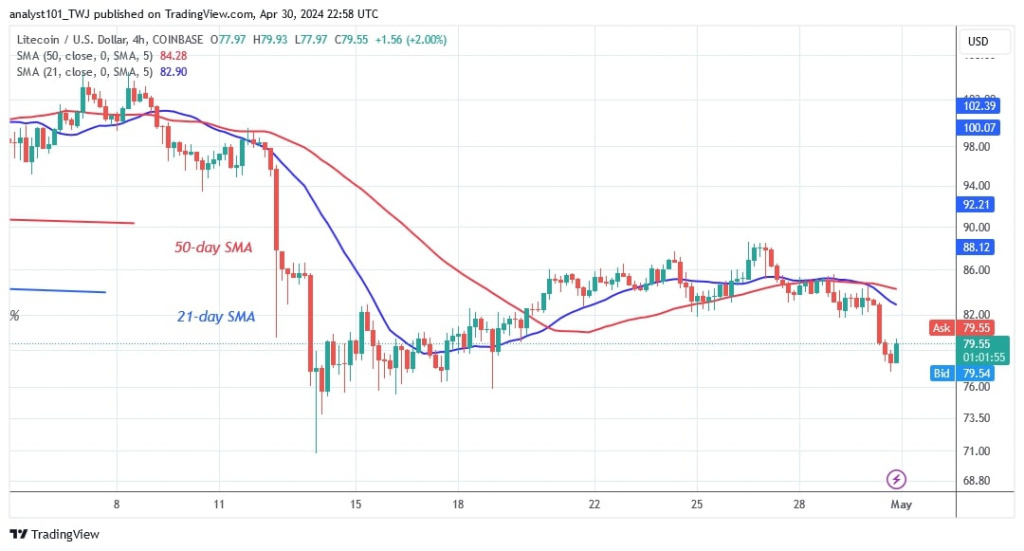
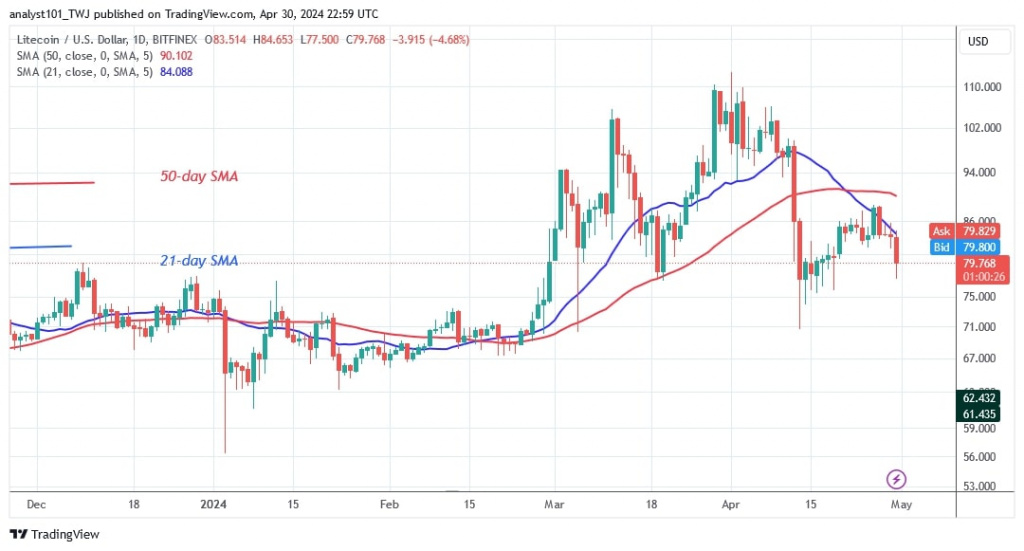
The price of Litecoin (LTC) has fallen below the moving average lines but remains above the support level of $73.
Long-term outlook for the Litecoin price: bearish
Over the past two weeks, Litecoin price has traded between the $73 support and the moving average lines or resistance at $86.
On the downside, the price of the cryptocurrency remains above the $73 support. Long candlestick tails are pointing towards the current support. If the current support is broken, Litecoin will return to its previous price of $70. The $70 level has not been broken since February 2024. Nonetheless, the current fluctuation will continue if the current support is maintained. Litecoin is now worth $76.70.
Litecoin indicator analysis
The selling pressure has eased and the price remains below the moving average lines. The price bars remain exposed to the resistance of the 21-day SMA. The cryptocurrency continues to encounter rejection at the moving average lines. Likewise, the trend will reverse if the moving average lines are broken.
Technical indicators
Resistance levels: $100, $120, $140
Support levels: $60, $40, $20
What’s the next move for Litecoin?
Litecoin continues to fluctuate and faces rejection from the 21-day SMA. The altcoin has fallen but has found support above $73. The bears are retesting the current price level as the altcoin bounces above the current support. The altcoin will perform if the current resistance and support levels are broken.
Coinidol.com reported on April 26, that Litecoin may fall below its previous low of $70 if it loses the current support, however, a week ago price was holding on the level of $85.

Disclaimer. This analysis and forecast are the personal opinions of the author and are not a recommendation to buy or sell cryptocurrency and should not be viewed as an endorsement by CoinIdol.com. Readers should do their research before investing in funds.


