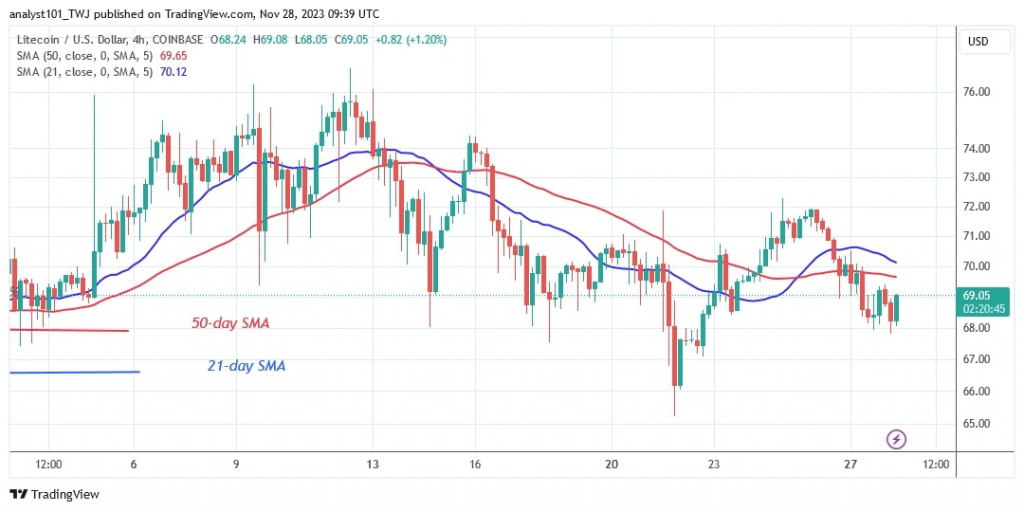
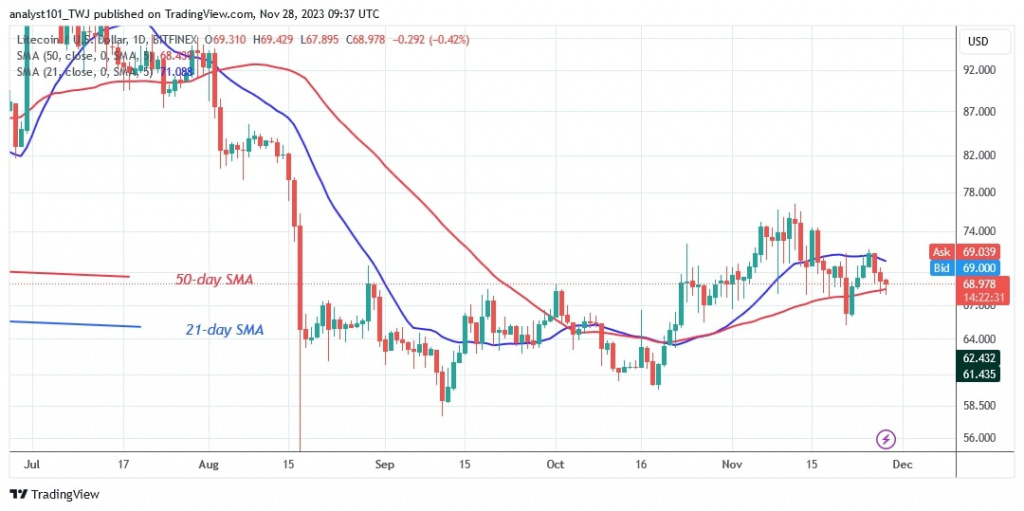
The price of Litecoin (LTC) is falling between the moving average lines. The altcoin is also trading within the previous price range of $60 to $70.
Litecoin price long term prediction: bearish
At the time of writing, the price of LTC has fallen to a low of $69.05. The presence of doji candlesticks is limiting the altcoin’s price movement. The cryptocurrency is trapped between the moving average lines.
Moreover, the price movement is monitored when it breaks either the 21-day or the 50-day SMA. If the bears break the 50-day SMA, the altcoin will fall into a price range between $60 and $70. If the bulls breach the barrier at $70 or the 21-day SMA, Litecoin will resume its uptrend.
Analysis of Litecoin indicators
Litecoin is trapped between the moving average lines, which means that the cryptocurrency will fluctuate. The cryptocurrency is expected to fall when the price bars on the 4-hour chart fall below the moving average lines. The moving average lines on both charts are sloping horizontally, indicating a sideways trend.
Technical indicators
Resistance levels: $100, $120, $140
Support levels: $60, $40, $20
What’s the next move for Litecoin
Litecoin is bearish but stuck in a range. The altcoin is expected to trade between $60 and $70. Rejection of the $72 high will cause the cryptocurrency to drop much further. Lower highs and lower lows will determine the decline.
On November 22, Coinidol.com reported that the price of Litecoin was also moving between $60 and $70. It was expected that this movement will continue for a few more days but the pattern is repeating itself.

Disclaimer. This analysis and forecast are the personal opinions of the author and are not a recommendation to buy or sell cryptocurrency and should not be viewed as an endorsement by CoinIdol.com. Readers should do their research before investing in funds.


