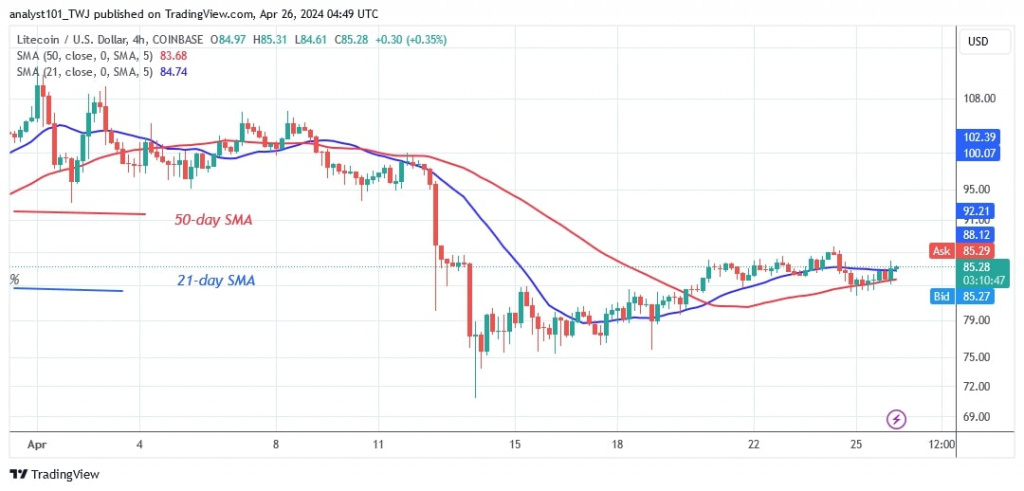
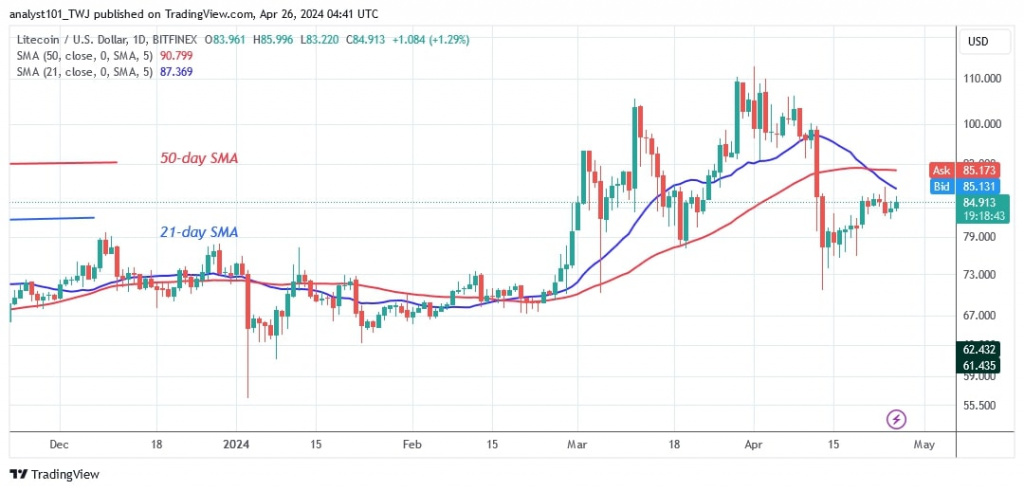
The price of Litecoin (LTC) fell to 70 dollars on April 13, 2024. Price analysis by Coinidol.com.
Long-term analysis for the Litecoin price: bearish
Selling pressure has eased as bulls have halted the decline above the $73 support. After the end of the downtrend, Litecoin has started a sideways trend above the $73 support but below the moving average lines or resistance at $90.
On the upside, Litecoin’s uptrend has stopped at the moving average lines, indicating a potential range-bound rise for the cryptocurrency. Litecoin is trading in the middle of its price range. Its uptrend will begin when it breaks above the moving average lines. It will rally to its previous high of $110. Similarly, Litecoin will fall below its previous low of $70 if it loses the current support. At the time of writing, it is currently worth $85.
Analyzing the Litecoin indicators
On the 4-hour chart, the moving average lines are sloping horizontally, indicating a sideways trend. The price bars are dominated by doji candlesticks that are above their moving averages. This explains traders’ ambivalence about the market direction.
Technical indicators
Resistance levels: $100, $120, $140
Support levels: $60, $40, $20
What’s the next move for Litecoin
Litecoin has risen above the $73 support level and continues to trend in a trading range. In the short term, the altcoin is consolidating above the current support with the emergence of doji candlesticks. Currently, the altcoin is trapped at the moving average lines with buyers trying to hold the price above these lines. The price rise will continue if the cryptocurrency is rejected at its recent high.

Disclaimer. This analysis and forecast are the personal opinions of the author and are not a recommendation to buy or sell cryptocurrency and should not be viewed as an endorsement by CoinIdol.com. Readers should do their research before investing in funds.


