Cryptocurrency analysts of Coinidol.com report, the price of Litecoin (LTC) resumed its sideways trend after falling below the moving average lines.
Long-term forecast of Litecoin price: in range
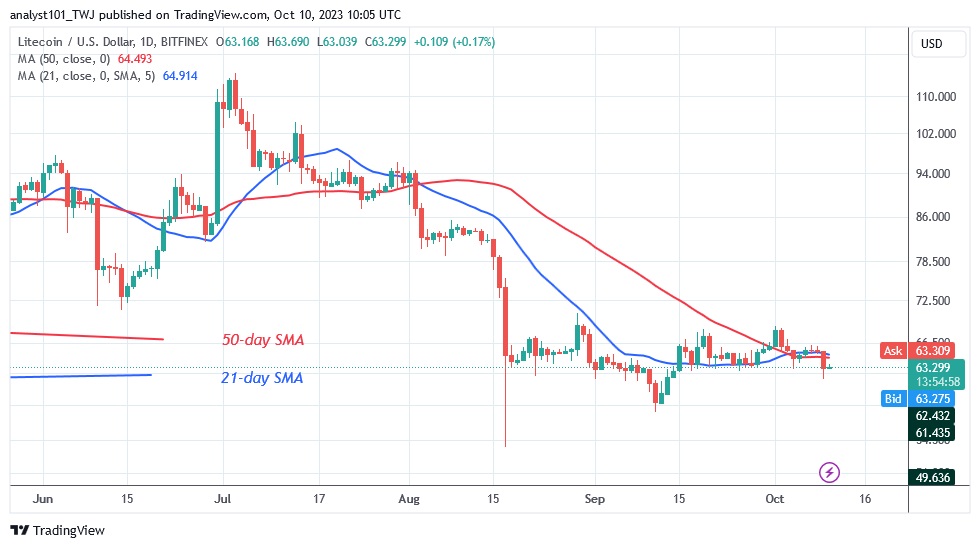
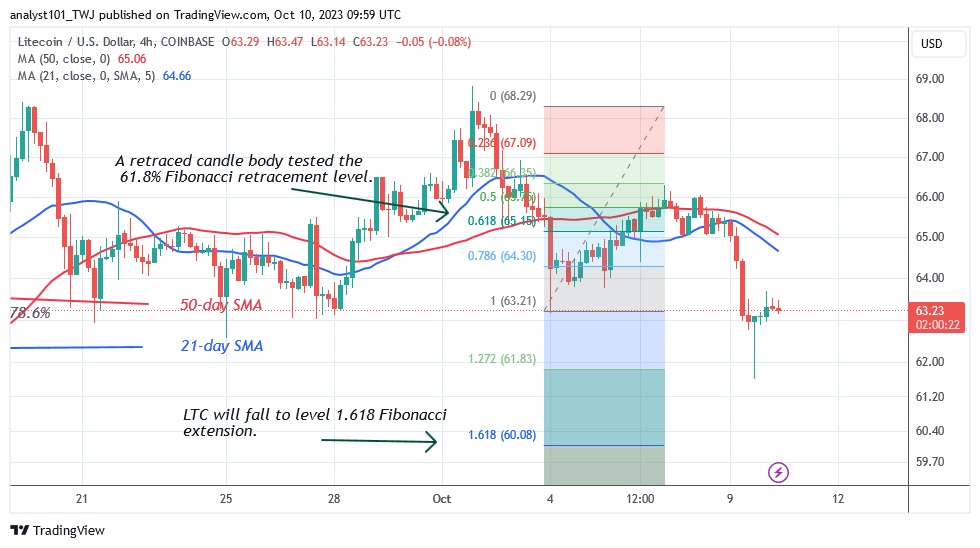
Litecoin was dumped on October 2 at a high of $68 as buyers failed to maintain upward momentum above the $68 resistance level. The price decline is expected to accelerate when the altcoin falls below the moving average lines. Meanwhile, the price of Litecoin is stuck between $61 and $68. According to the price indication, LTC will continue to fall to a low of $60. The cryptocurrency is falling as it approaches the previous low of August 17. On August 17, the altcoin hit a low of $0.53.
Litecoin indicator analysis
The horizontal slope of the moving average lines currently indicates a sideways trend. The price of the cryptocurrency may decline as long as the price bars are below the moving average lines. Doji candlesticks, which limit the price movement, determine the LTC price. Moreover, the altcoin is trading in an oversold area of the market.

Technical indicators
Resistance levels: $100, $120, $140
Support levels: $60, $40, $20
What is the next move for Litecoin?
The cryptocurrency’s price is likely to stay within its limited range. It is currently falling into a lower price range. On the downside, the market will fall and reach its previous low of $0.53 if the bears break the lower price range. The decline had previously reached a low of $63.

On October 3, 2023 cryptocurrency analytics specialists of Coinidol.com stated that since August 29, the resistance zone of $70 has stopped the rising movement. The October 1 rise will be the third attempt by buyers to maintain positive momentum above the moving average lines.
Disclaimer. This analysis and forecast are the personal opinions of the author and are not a recommendation to buy or sell cryptocurrency and should not be viewed as an endorsement by CoinIdol.com. Readers should do their research before investing in funds.


