The price of Litecoin (LTC) is in an uptrend before falling below the moving average lines and above the $70 support level.
Long-term forecast for the Litecoin price: bearish
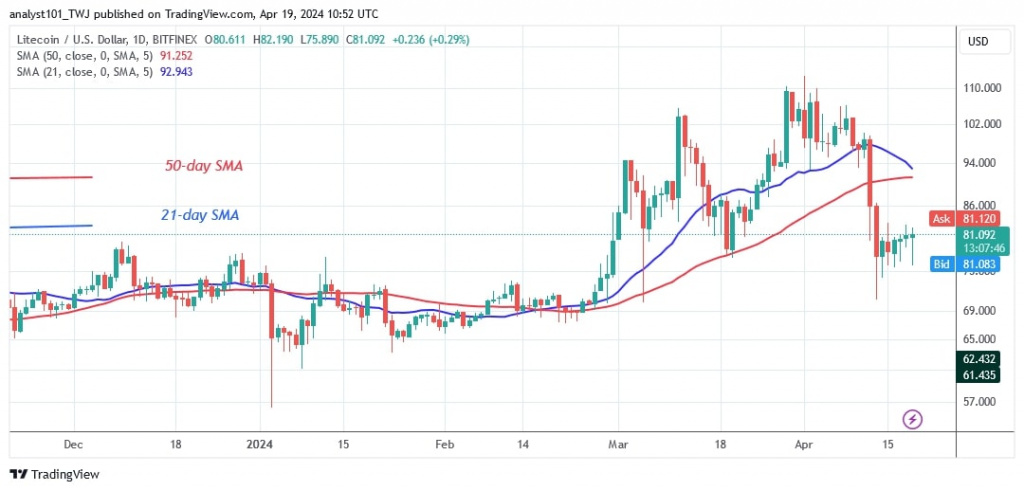
The altcoin recovered from an earlier decline before hitting resistance at $110. On March 29, buyers pushed the altcoin to a high of $110. The bulls tested the resistance area three times but could not sustain their upside momentum above this level.
The cryptocurrency quickly fell below the moving average lines on April 3 after retracing above the 21-day SMA. Litecoin fell to a low of $70, but bulls bought on dips. LTC/USD is now at $81.15.
On the downside, Litecoin is consolidating above the $79 support due to the doji candlesticks. On the upside, Litecoin will continue a positive trend if buyers keep the price above the moving average lines or break the resistance at $100.
Analysis of Litecoin indicators
After the recent drop on April 13, 2024, the price of the cryptocurrency is now below the moving average lines. The altcoin is now in a downtrend and could fall further. However, the April 13 candle showed a long tail, indicating strong buying above the $70 support.
Technical indicators
Resistance levels: $100, $120, $140
Support levels: $60, $40, $20
What’s next for Litecoin?
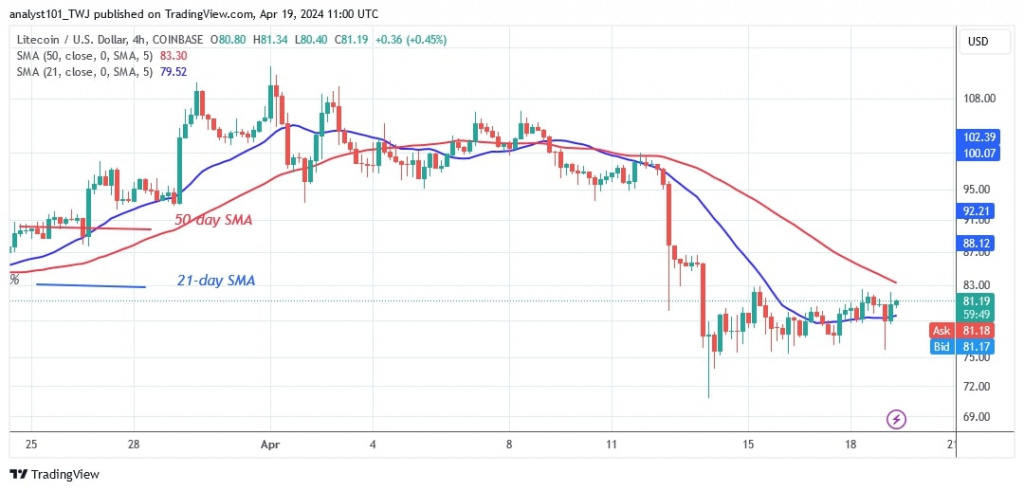
After the end of the decline, Litecoin is now trading in a sideways pattern. On the 4-hour chart, the altcoin is trading above the $75 support but below the $83 resistance level. Doji candlesticks have limited the price movement within a certain range. The altcoin will perform once the current price range is broken.

Disclaimer. This analysis and forecast are the personal opinions of the author and are not a recommendation to buy or sell cryptocurrency and should not be viewed as an endorsement by CoinIdol.com. Readers should do their research before investing in funds.


